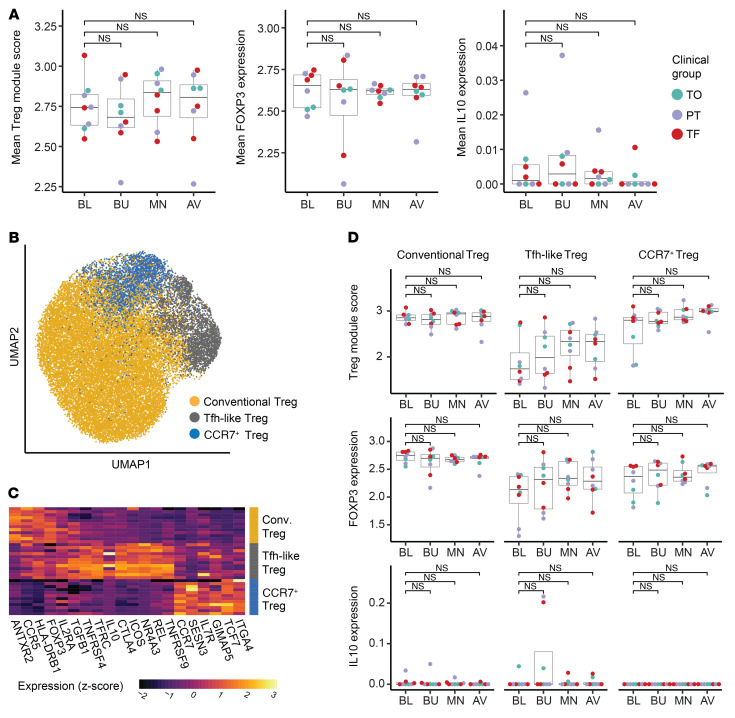
Figure 6. Treg phenotypes are not significantly modulated by OIT.
(A) Average expression of Treg module (gene module 1), FOXP3, and IL10 by patient and time point within Treg clones. Each data point represents the mean expression of all Treg clones for a given patient at a given time point. (B) UMAP visualization of all Tregs (data from all patients at all time points), colored by cluster assignment and labeled by putative cluster identity. (C) Differentially expressed genes in each Treg cluster. Genes were selected using an ROC test and manual curation. Each row represents the scaled average gene expression in 1 patient. (D) Average expression of the Treg module (top), FOXP3 (middle), and IL10 (bottom) by patient and time point within clones of each Treg cluster, colored by clinical group. Adjusted P values were calculated by paired Wilcoxon rank sum test (A and D).

