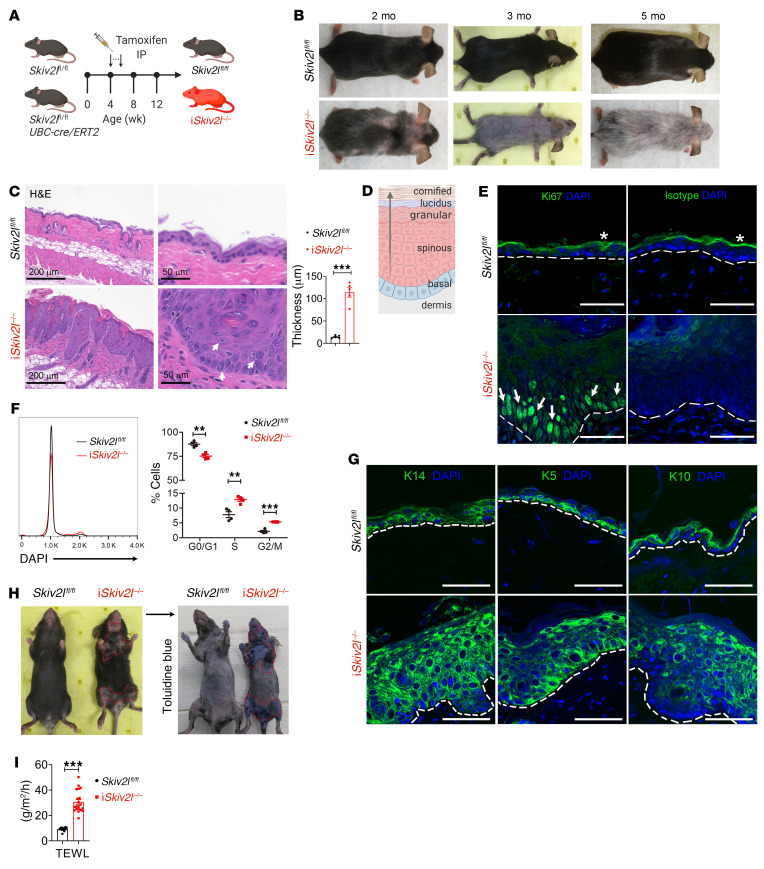
Figure 1. Loss of epidermal homeostasis and skin barrier integrity in postnatal inducible whole-body Skiv2l knockout mice.
(A) A schematic diagram showing experimental design for generation of postnatal tamoxifen-inducible whole-body Skiv2l knockout mice (iSkiv2l–/–) by intraperitoneal tamoxifen injection in Skiv2lfl/flUBC-cre/ERT2 mice. (B) Skin lesion and hair loss of iSkiv2l–/– mice at indicated ages. (C) H&E staining of iSkiv2l–/– mouse dorsal skin and Skiv2lfl/fl littermate controls (3 months old). White arrows, enlarged keratinocytes with loose chromatin. Quantification of epidermal thickness of iSkiv2l–/– and Skiv2lfl/fl is shown on the right bar graph. n = 5 mice per genotype. Unpaired 2-sided Student’s t test, ***P < 0.001. (D) A schematic diagram showing epidermal layers. (E) Fluorescence immunohistochemistry analysis of proliferation marker Ki67 (green signaling in the nucleus) of iSkiv2l–/– mouse dorsal skin and Skiv2lfl/fl littermate controls (3 months old). Nuclei were counterstained with DAPI (blue). White arrows, Ki67 positive cells. Asterisk indicates nonspecific staining of stratum corneum of epidermis. Isotype IgG was used as a negative control. Dashed line, epidermal-dermal junction. Scale bar: 50 μm. (F) Cell-cycle analysis of keratinocytes isolated from iSkiv2l–/– mice and Skiv2lfl/fl littermate controls (3 months old). Statistical analysis of cell-cycle distributions are shown on the right. n = 4 per genotype. Unpaired 2-sided Student’s t test, **P <0.01, ***P < 0.001. (G) Fluorescence immunohistochemistry analysis of keratinocyte differentiation markers K14, K5, and K10 in iSkiv2l–/– mouse dorsal skin and Skiv2lfl/fl littermate controls (3 months old). Nucleus was stained with DAPI (blue). K14, keratin 14; K5, keratin 5; K10, keratin 10. Dashed line, epidermal-dermal junction. Scale bar: 50 μm. (H) Representative Toluidine blue staining of depilated iSkiv2l–/– mice and Skiv2lfl/fl littermate controls. (I) TEWL of iSkiv2l–/– mice (n = 20) and Skiv2lfl/fl littermate controls (n = 11). Unpaired 2-sided Student’s t test, ***P < 0.001.

