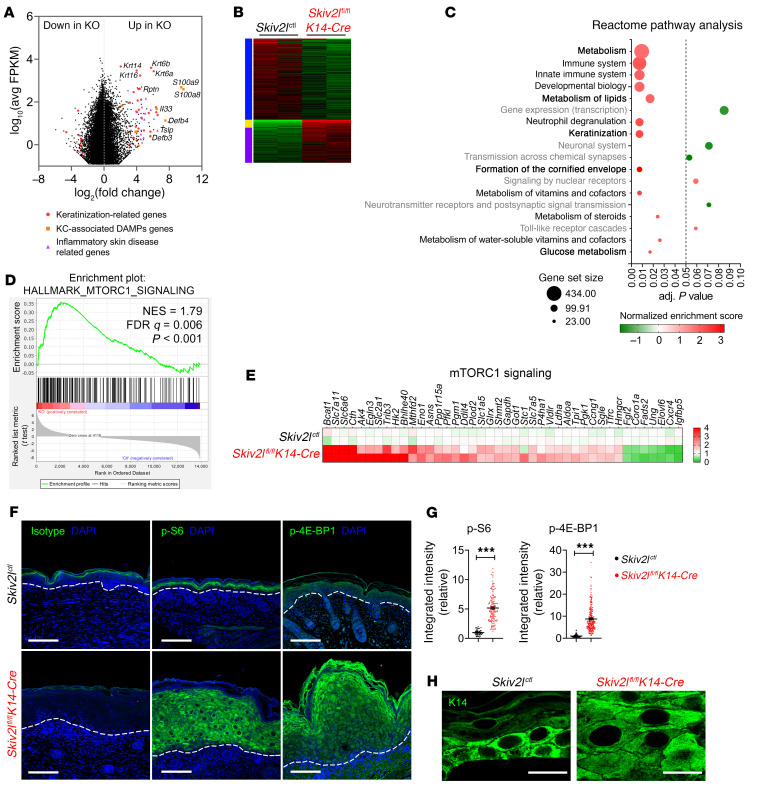
Figure 4. Aberrant activation of the mTORC1 pathway in keratinocytes of germline keratinocyte-specific Skiv2l knockout mice.
(A) MA plot comparing gene expression of Skiv2lctl and Skiv2lfl/flK14-Cre (germline keratinocyte-specific Skiv2l knockout) P0 epidermis (n = 2 mice per genotype). Data are shown as average gene expression (log10 average FPKM) on the y axis and log2-fold change (Skiv2lfl/flK14-Cre [KO] versus Skiv2lctl) on the x axis, with direction of enrichment as indicated. Red dots, keratinization-related genes; orange squares, keratinocyte-associated DAMPs genes; purple triangles, inflammatory skin disease related genes. (B) Heatmap of DEGs of Skiv2lctl versus Skiv2lfl/flK14-Cre. n = 2 mice per genotype. (C) Reactome pathway analysis of DEGs of Skiv2lctl versus Skiv2lfl/flK14-Cre. Dashed line showing adjusted P value as 0.05. Pathways without statistical significance (adj. P value > 0.05) are shown in gray. Normalized enrichment score (NES) is shown with color bar (red, enriched in Skiv2lfl/flK14-Cre; green, enriched in Skiv2lctl). Circle size indicates number of genes in a gene set. (D) GSEA of Skiv2lctl and Skiv2lfl/flK14-Cre P0 epidermis RNA-seq data set. GSEA plot of hallmark mTORC1 signaling. (E) A heatmap showing gene expression of the mTORC1 pathway in Skiv2lctl and Skiv2lfl/flK14-Cre P0 epidermis. n = 2 mice per genotype. (F and G) Fluorescence immunohistochemistry analysis of p-S6 ribosomal protein (S235/236) and p-4E-BP1 (T37/46) in Skiv2lctl and Skiv2lfl/flK14-Cre P0 pup skin tissues (F). Dashed line, epidermal-dermal junction. Scale bar: 50 μm. Quantification of p-S6 or p-4E-BP1 fluorescence intensity per cell (>50 cells each genotype) is shown in (G). Unpaired 2-sided Student’s t test, ***P < 0.001. (H) Representative images showing enlarged keratinocyte cell size in Skiv2lfl/flK14-Cre P0 pup skin. Scale bar: 20 μm. The K14 immunofluorescence images of Skiv2lfl/fl and iSkiv2l–/– epidermis are crops of images shown in Figure 3H.

