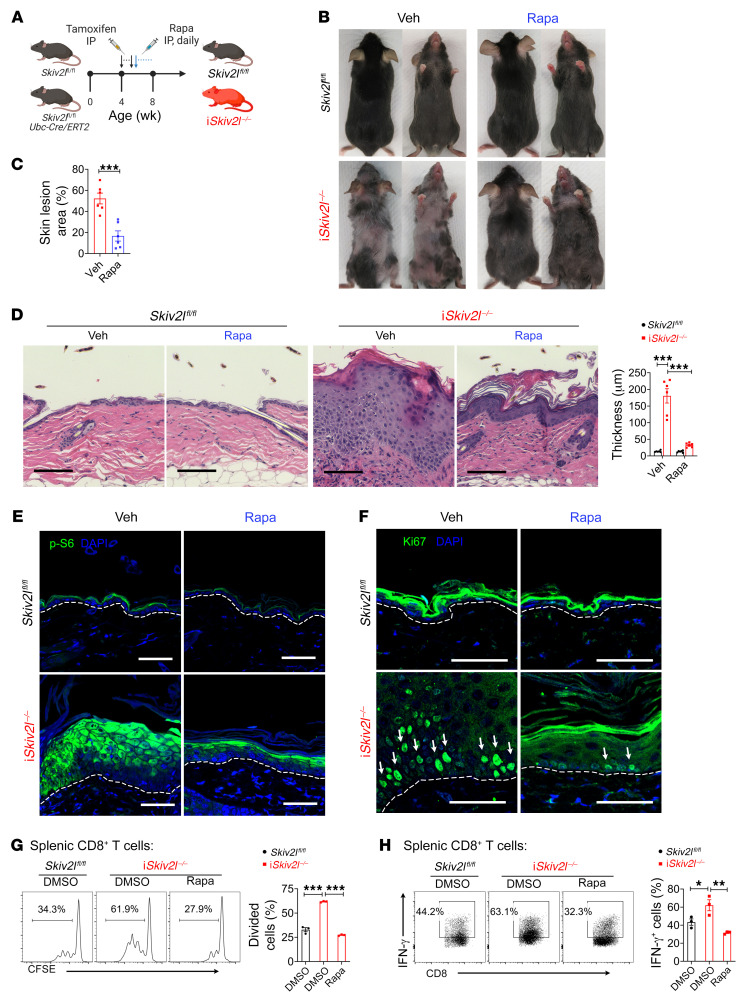
Figure 6. mTORC1 inhibitor rapamycin ameliorates disease pathology in postnatal whole-body inducible Skiv2l knockout mice.
(A) A schematic diagram showing experiment design of rapamycin treatment by intraperitoneal injection in iSkiv2l–/– mice and Skiv2lfl/fl controls. (B and C) Representative images of iSkiv2l–/– and Skiv2lfl/fl mice treated with rapamycin (Rapa, 8 mg/kg body weight, i.p.) or vehicle (veh) for 4 weeks. Quantification of area with lesion on ventral skin is shown on right bar graph (C). n = 6 per group. Two-sided Student’s t test, ***P < 0.001. (D) H&E staining of iSkiv2l–/– and Skiv2lfl/fl mouse dorsal skin after treatment with rapamycin or vehicle (as in B). Quantification of epidermal thickness is showing on the right bar graph. n = 6 mice per group. Two-way ANOVA with post hoc Tukey’s multiple comparisons test, ***P < 0.001. (E and F) Fluorescence immunohistochemistry analysis of p-S6 ribosomal protein (S235/236) (E) and proliferation marker Ki67 (F) of iSkiv2l–/– and Skiv2lfl/fl mouse dorsal skin after treatment with rapamycin or vehicle (as in B). White arrows in F denote Ki67-positive cells. Scale bar: 50 μm. (G) T cell proliferation analysis by the CFSE dilution assay. iSkiv2l–/– and Skiv2lfl/fl splenic CD8+ T cells were stained with CFSE then stimulated with anti-CD3 and anti-CD28 (3 μg/mL) in the presence of rapamycin or vehicle DMSO. One-way ANOVA with post hoc Tukey’s multiple comparisons test, ***P < 0.001. (H) Intracellular IFN-γ staining of iSkiv2l–/– and Skiv2lfl/fl splenic CD8+ T cells stimulated with anti-CD3 and anti-CD28 (3 μg/mL) in the presence of rapamycin or vehicle DMSO. One-way ANOVA with post hoc Tukey’s multiple comparisons test, *P < 0.05, **P < 0.01.

