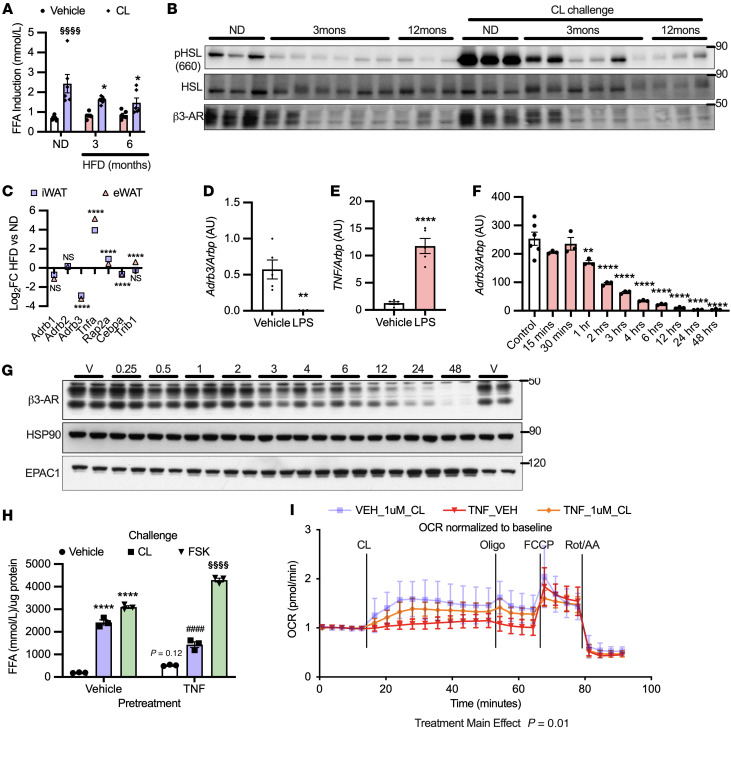
Figure 3. Heterologous desensitization of the adipocyte β3-AR occurs with obesity in mice and proinflammatory cytokine stimulation in vitro.
(A and B) Mice on HFD for 3 or 12 months (n = 3–6 per group) were challenged with 0.5 mg/kg CL-316243 and pHSL, with β3-AR expression and serum FFA normalized to baseline measured as before. §Significance compared with vehicle; *significance compared with ND-CL-316243. (C) RNA-Seq from isolated adipocytes of iWAT and eWAT in mice fed HFD for 16 weeks (n = 3 per group). *Significance between HFD and ND for the listed genes. (D and E) Mice were treated with 10 mg/kg LPS for 18 hours and gene expression assessed in eWAT (n = 5 per group). (F) Adrb3 (n = 3 per group repeated once) and (G) β3-AR were assessed as before with 17 ng/mL TNF-α treatment. n = 3 per group. (H) 3T3L1 adipocytes were pretreated and challenged as before then FFAs (n = 3 per group) measured as in Figure 1, D and E. (H) Experiments shown in part H had the same experimental design as in Figure 1D, except pretreatment was 17 ng/mL TNF-α. Significance symbols are as described for Figure 1, D and E. (I) Oxygen consumption rates after 18 hours pretreatment with 17 ng/mL TNF-α were determined by Seahorse using PPDIVs (n = 8 per group). *Significance compared with control unless otherwise specified. Controls in I were also used for Figure 1 for cognate experiments, as these assays were carried out simultaneously. Two-way ANOVA with Šidák’s (A) and Tukey’s (H) multiple comparisons; t tests and FDR applied to correct for multiple comparisons (C); independent samples t test (D and E); 1-way ANOVA with Dunnett’s post hoc test (F); 2-way mixed ANOVA (time × treatment) with Tukey’s post hoc test (I). Error bars represent SEM. *P < 0.05; **P < 0.01; ***P < 0.001; ****P < 0.0001. ####P < 0.0001. §§§§P < 0.001.

