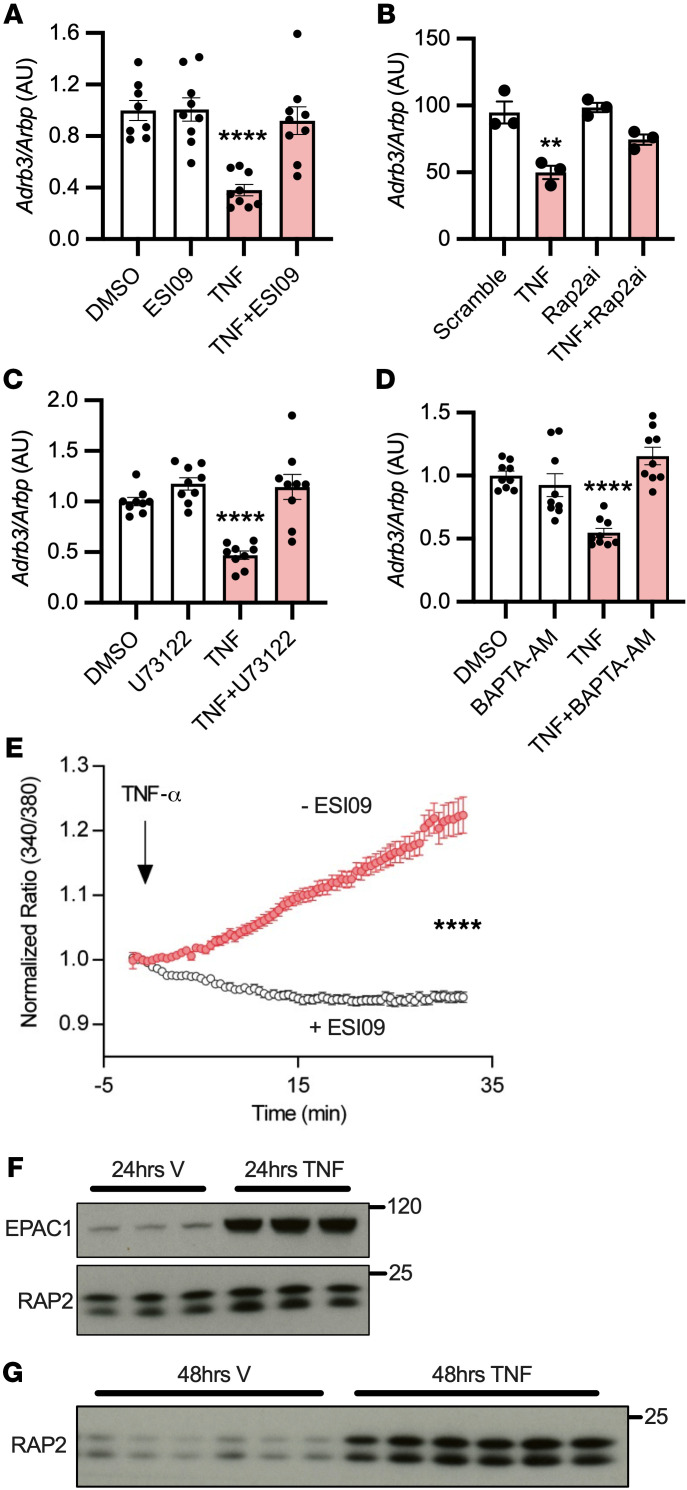
Figure 4. Heterologous desensitization of β3-AR occurs through activation of the same EPAC/RAP2A/PLC pathway.
(A) 3T3L1 adipocytes were pretreated with 10 μM ESI09 for 1 hour, then challenged with 17 ng/mL TNF-α for 3 hours (n = 3 per group from 3 independent experiments). (B) 3T3L1 adipocytes were transfected with siRNA against RAP2A and challenged with 17 ng/mL TNF-α (3 hours) (n = 3 per group). (C and D) 3T3L1 adipocytes were pretreated for 1 hour with 10 μM U73122 or 50 μM BAPTA-AM, followed by 3 hours challenge with 17 ng/mL TNF-α (n = 3 per group from 3 independent experiments). (E) 3T3L1 adipocytes were pretreated with vehicle or 10 μM ESI09 for 1 hour and challenged with 17 ng/mL TNF-α; calcium flux was assessed in live cells using Fura2-AM (106 randomly chosen cells from 4 experiments [red] and 86 from 3 experiments [gray]). Graph represents the subpopulation of cells that responded to TNF-α (~20%). (F and G) 3T3L1 adipocytes were treated for the indicated times with 17 ng/mL TNF-α (n = 3–6 per group). Data points for DMSO control and inhibitor alone in A, C, and D were also used for Figure 2 for their cognate experiments, as these assays were carried out simultaneously. *Significance compared with control or GFP unless otherwise specified. One-way ANOVA with Tukey’s post hoc comparisons (A–D); independent samples t test (E). Error bars represent SEM. **P < 0.01; ****P < 0.0001.

