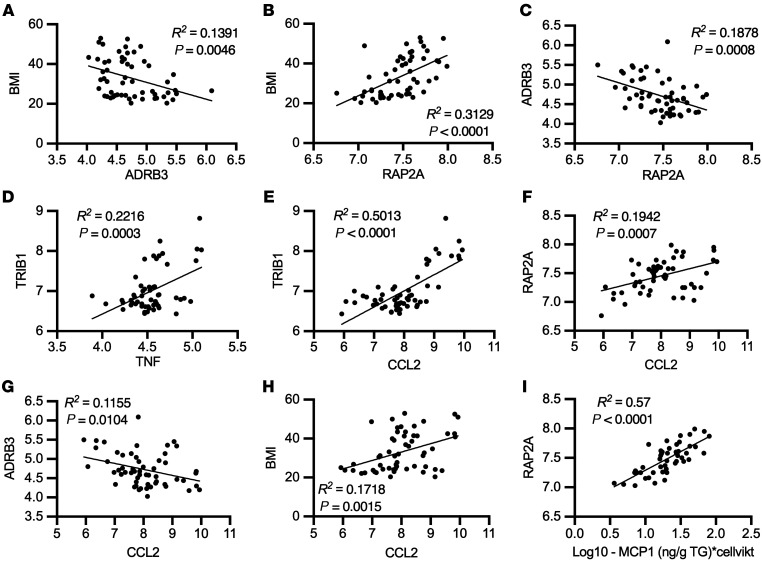
Figure 8. Human subcutaneous abdominal adipose tissue gene expression data of pathway members shown in Figure 6 correlate with BMI, inflammation, and each other.
(A–H) Correlations between gene expression levels from microarray of human abdominal subcutaneous adipose tissue from women with varying BMIs (n = 56). (I) Correlations between isolated adipocyte secretion of MCP-1 and gene expression from these participants. Linear regression (A–I).

