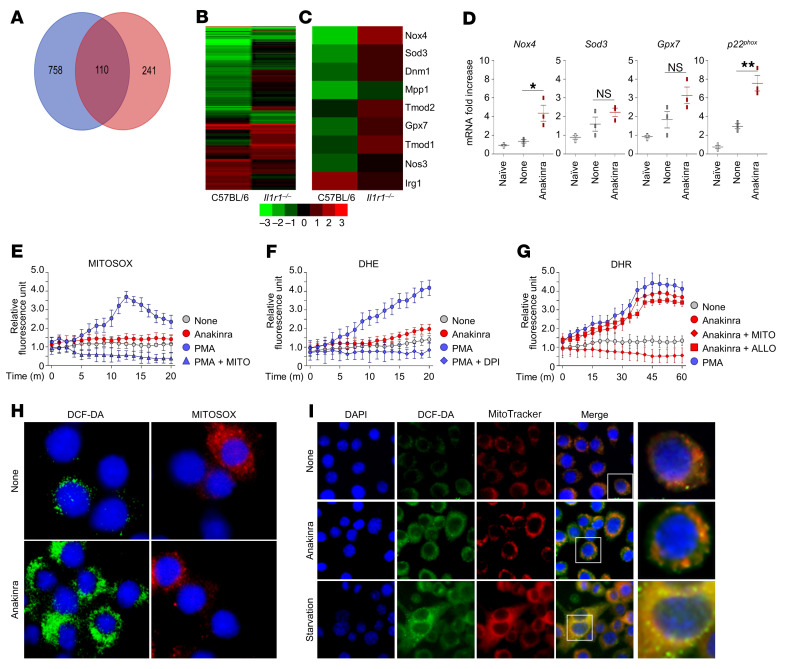
Figure 2. Anakinra affects mitochondrial redox balance in the absence of IL-1R1.
(A) Genes differentially expressed in response to anakinra in purified alveolar macrophages from C57BL/6 and Il1r1–/– mice stimulated in vitro with 10 μg/mL of anakinra for 4 hours. (B and C) Hierarchical clustering (fold change > 2, P value < 0.05, FDR < 0.05) by RNA-Seq of all genes (B) and genes involved in oxidative stress (C). (D) RT-PCR on total lung cells from Il1r1–/–mice at 7 days after A. fumigatus i.n. infection. *P < 0.05 and **P < 0.01, anakinra-treated versus untreated (None) mice. NS, not statistically significant. One-way ANOVA, Bonferroni post hoc test. Data are the mean ± SEM of 1 representative out of 3 independent experiments. (E–G) RAW 264.7 cells were exposed to 10 ng/mL PMA or 10 μg/mL anakinra for 4 hours at 37°C in the presence of diphenylene iodonium (DPI), allopurinol (ALLO), or MitoTEMPO (MITO) with the addition of MitoSOX red (E), DHE (F), and DHR (G) for mitochondrial superoxide, NADPH-dependent superoxide, and mitochondrial hydrogen peroxide assessment, respectively. Fluorescence was measured at 510 excitation and 580 emission. The results presented for all fluorimetric measurements are the mean ± SEM of 1 representative out of 3 independent experiments, tested in duplicate. Two-way ANOVA, Bonferroni post hoc test. (H) Fluorescence of RAW 264.7 cells exposed to anakinra and stained with DCF-DA or MitoSOX red. (I) RAW 264.7 cells were starved or exposed to anakinra before visualization (magnified in the last column) of H2O2/mitochondria colocalization by staining with DCF-DA and MitoTracker red probes, respectively. Starvation was carried out in Earle’s balanced salt solution. DAPI was used to detect nuclei. Images were acquired using the Olympus BX51 fluorescence microscope. For P value, see Supplemental Figure 5.

