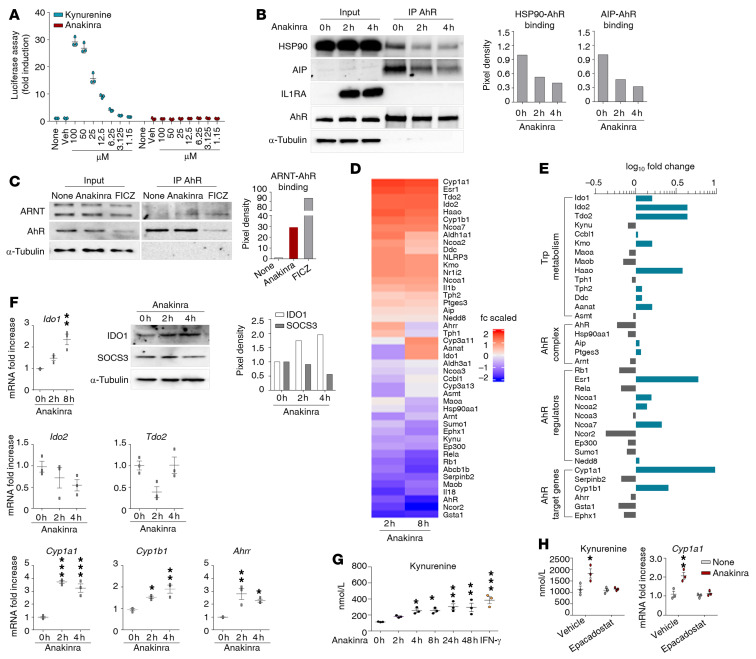
Figure 5. Anakinra activates a xenobiotic sensing pathway via IDO1.
(A) H1L1 cells were treated with different doses of kynurenine and anakinra for 6 hours and assessed for luciferase assay. (B) Representative immunoblots of IL1RA, HSP90, AIP, and AhR and (C) ARNT and AhR in cell lysates in which AhR was immunoprecipitated from Il1r1–/– MEF cells treated with 10 μg/mL anakinra or 10 μM FICZ. In B and C, data are representative of 1 out of 2 independent experiments and the relative densitometric analysis are reported. (D and E) Il1r1–/– MEF cells were treated with 10 μg/mL anakinra for 2 and 8 hours and analyzed for gene expression by a custom QuantiGene plex gene expression assay. Fold changes are reported as heatmap for 2 and 8 hours (D) and histograms for 8 hours (E) (data are representative of 1 out of 2 independent experiments). (F) Il1r1–/– MEF cells were treated with 10 μg/mL anakinra and analyzed for mRNA expression of selected genes by RT-PCR (n = 3 independent samples) and protein expression of IDO1 and SOCS3 by immunoblotting (representative experiment). The relative densitometric analysis is reported. (G) Il1r1–/– MEF cells were treated with either 10 μg/mL anakinra for different times or 10 ng/mL IFN-γ as positive control for 48 hours and assessed for kynurenine production by ELISA. (H) Il1r1–/– MEF cells were treated with 10 μg/mL anakinra in the presence or absence of 10 μM epacadostat and assessed for kynurenine production by ELISA and Cyp1a1 gene expression by RT-PCR (n = 3 independent samples). *P < 0.05, **P < 0.01, ***P < 0.001, treated versus untreated (None or 0 h) cells. One-way ANOVA, Bonferroni post hoc test.

