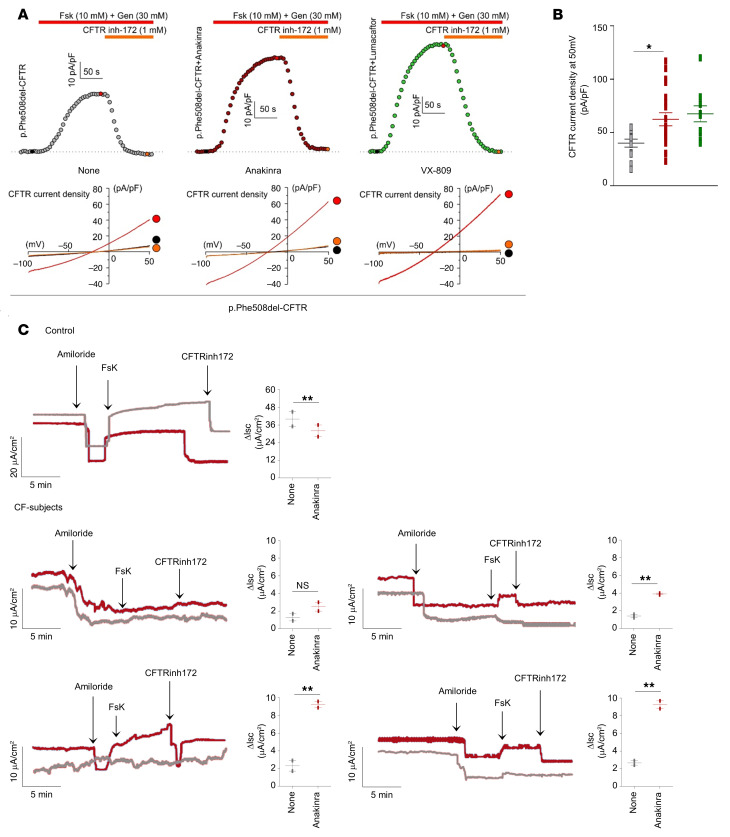
Figure 9. Anakinra increases CFTR activity.
(A) Time course of whole-cell CFTR current densities induced by 10 μM forskolin (Fsk) + 30 μM genistein (Gen) at +50 mV in p.Phe508del-CFTR–transfected FRT cells treated with 10 μg/mL anakinra, 3 μM VX-809, or DMSO (None) for 4 hours at 37°C followed by blockade with CFTR inhibitor 172 (CFTR inh-172). The horizontal bars indicate the time period of drug application. Inset, current ramps from −100 mV to +50 mV (holding potential, −40 mV) in control condition (black trace), after application of Fsk + Gen (red trace), and after application of 1 μM CFTRinh-172 (orange trace). (B) Mean ± SEM CFTR current density measured at +50 mV induced by Fsk and Gen in cells treated with anakinra (n = 20), VX-809 (n = 10), or vehicle (n = 12). *P < 0.05, anakinra versus untreated (None), 1-way ANOVA, Bonferroni post hoc test. (C) CFTR-dependent chloride secretion measured by means of Fsk-induced increase in the Isc in HBE cells from 4 patients with CF and 1 representative control treated with anakinra for 4 hours at 37°C and mounted in Ussing chambers in the presence of CFTR inhibition (CFTR inh-172) and amiloride. **P < 0.01, anakinra-treated versus untreated (None) cells. NS, not statistically significant. Student’s t test. Data are from 2 experiments.

