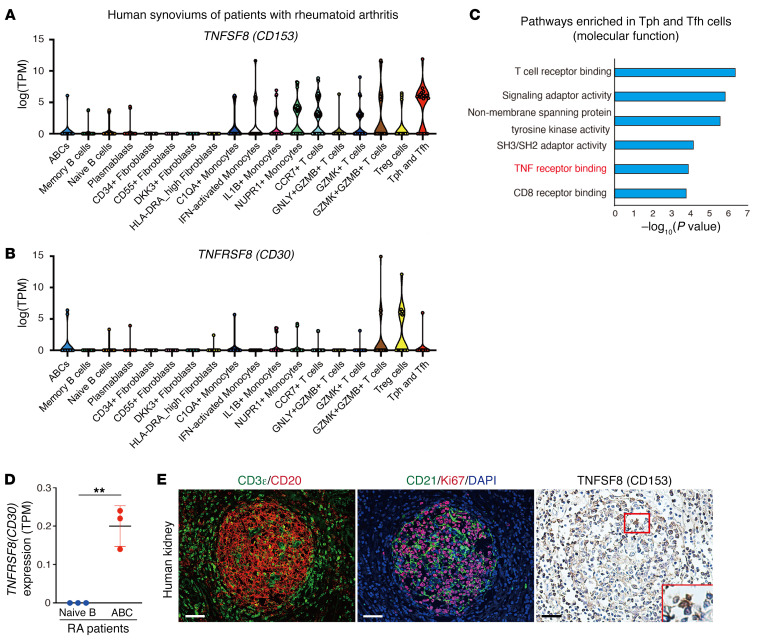
Figure 11. Human Tph/Tfh cells and ABCs express TNFSF8 and TNFRSF8, respectively.
(A and B) Reanalysis of published scRNA-Seq data of human samples. TNFSF8 and TNFRSF8 expression in various types of T cells and B cells in the synovium of patients with rheumatoid arthritis (RA) (log[TPM]). Data are shown as median (Kruskal-Wallis test followed by 2-sided Wilcoxon’s rank-sum test). (C) Enrichment analysis of molecular function ontology in Tph and Tfh cells in A. The x axis denotes the –log10 of enrichment P values calculated utilizing a t test for the enrichment of a specific pathway. (D) TPM values of TNFRSF8 in naive B cells and ABCs from the peripheral blood of patients with RA (n = 3 per group). Data are presented as mean ± SD, and statistical significance was determined by an unpaired, 2-tailed t test. (E) Immunofluorescence of CD3ε and CD20, CD21 and Ki67, and immunohistochemistry of TNFSF8 in human kidneys. Magnified views of the outlined box are shown in the lower right. Scale bars: 50 μm. Data in A–C and D were derived from Zhang et al.’s (43) and Wang et al.’s (28) data sets, respectively. **P < 0.01.

