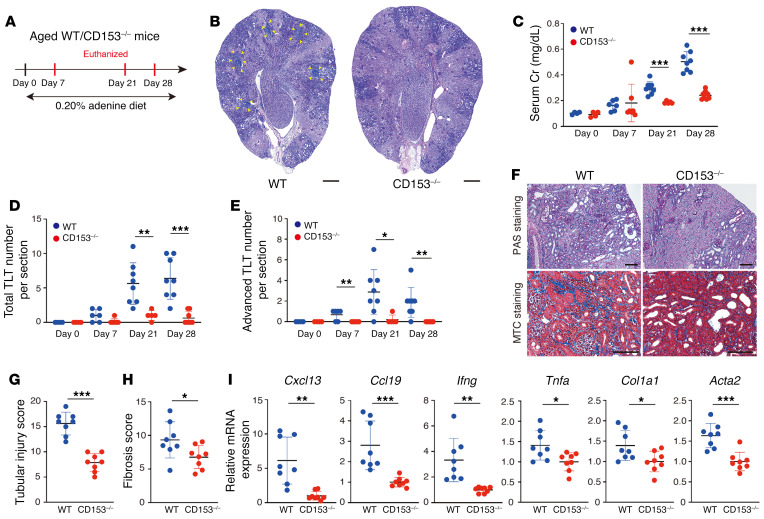
Figure 8. Aged CD153–/– mice exhibit attenuated TLT formation with improved inflammation, fibrosis, and renal function in adenine nephropathy model.
(A) Experimental protocol for B–I (n = 4–9 at each time point). In 0.20% adenine nephropathy models, CD153-deficient (CD153–/–) mice exhibited defective TLT formation and attenuated renal dysfunction, inflammation, and fibrosis, as shown by (B) periodic acid–Schiff (PAS) staining, (C) serum creatinine (sCr) levels, (D) total TLT numbers, (E) advanced-stage TLT numbers, (F) PAS and Masson’s trichrome (MTC) staining, (G) tubular injury scores, (H) fibrosis scores, and (I) Cxcl13, Ccl19, Ifng, Tnfa, Col1a1, and Acta2 mRNA levels. Data are presented as mean ± SD. The yellow arrowheads in B indicate the localization of TLTs. Statistical significance was determined by an unpaired, 2-tailed t test. *P < 0.05; **P < 0.01; ***P < 0.001. Scale bars: 300 μm (B) and 100 μm (F).

