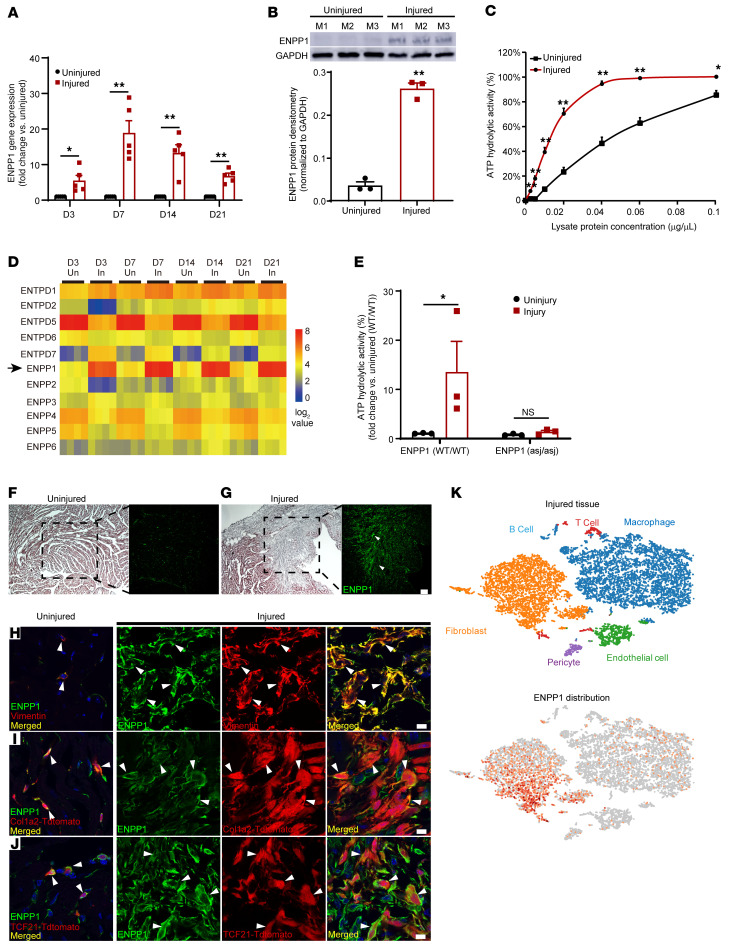
Figure 1. ENPP1 is expressed in the infarcted heart by nonmyocytes and is the principal ectonucleotidase that hydrolyzes extracellular ATP.
(A) qPCR demonstrating ENPP1 gene expression in the injured region of the heart compared with uninjured regions at 3, 7, 14, and 21 days after MI (n = 5). (B) Western blotting and quantitative densitometry demonstrating ENPP1 protein levels in injured and uninjured regions of the heart at 7 days following MI (n = 3). (C) ATP hydrolytic activity at various concentrations of the injured heart tissue homogenate compared with that in uninjured tissue homogenate 7 days after MI (n = 3). (D) Heatmap with gene expression patterns of ENPP1 (arrow) and other members of the ENPP and ectonucleotidase family in the injured versus uninjured regions of the heart (n = 4/time point). (E) ATP hydrolytic activity at 7 days after MI in WT mice and ENPP1asj/asj mutant mice (n = 3). (F and G) H&E staining and immunostaining for ENPP1 (green, arrowheads) in the uninjured (F) and injured (G) regions at day 7 after MI. Scale bar: 100 μm (high magnification). Low magnification: ×4. (H) Immunostaining for ENPP1 and vimentin in the uninjured and injured regions at 7 days after MI (arrowheads indicate ENPP1 and vimentin colocalization in merged images). (I and J) Immunostaining of ENNP1 expression in genetically labeled CFs in (I) Col1a2CreERT:R26Rtdtomato or (J) TCF21MCM:R26Rtdtomato mice at 7 days after MI (arrowheads indicate where ENPP1-expressing cells coexpress the fibroblast tdTomato label, representative images; n = 3). Scale bars: 10 μm. (K) Single-cell RNA-Seq of nonmyocytes at 7 days after MI demonstrating cell phenotypes in clusters and ENPP1 distribution (n = 3). Data are represented as mean ± SEM. **P < 0.01; *P < 0.05, 2-tailed Student’s t test (A–C and E).

