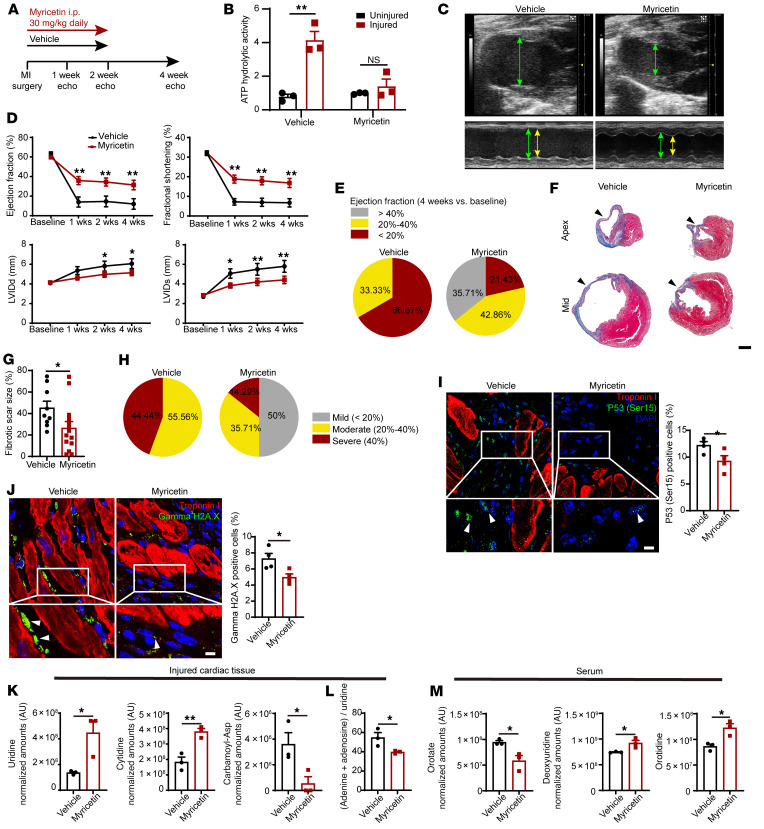
Figure 11. Animals treated with ENPP1 inhibitor myricetin demonstrate significant improvement in heart function after injury.
(A) Strategy for using myricetin. (B) Extracellular ATP hydrolytic activity in injured and uninjured hearts of animals treated with myricetin (n = 3). (C) B and M mode echocardiogram demonstrating contractile function in diastole (green arrows) and systole (yellow arrows) in hearts of myricetin-treated animals. (D) EF, fractional shortening, and LV chamber size in systole and diastole in vehicle- or myricetin-treated animals. n = 12 (vehicle) and n = 15 (myricetin) at basal, 1 week, and 2 weeks; n = 9 (vehicle) and n = 14 (myricetin) at 3 weeks and 4 weeks. (E) Fractions of animals with mild, moderate, and severe reduction in EF at 4 weeks after injury. (F) Scar size as a fraction of LV surface area. Scale bar: 1 mm. (G) Quantitation of scar surface area. n = 9 (vehicle); n = 4 (myricetin). (H) Fractions of animals with mild, moderate, and severe fibrosis following myricetin administration. (I and J) Immunostaining demonstrating (I) p53 (Ser15 phosphorylation) expression (arrowhead) in nonmyocytes in the injured region of vehicle- versus myricetin–injected animals and under higher magnification (myocytes are stained by troponin) and quantification (n = 4). (J) pH2AX staining in nonmyocyte cells (arrowheads) in vehicle- or myricetin-injected animals at 7 days following injury, under higher magnification and quantitation (n = 4, counts normalized to number of nonmyocyte nuclei for I and J). Scale bars: 5 μm (high magnification). Low magnification, ×40. (K) Metabolomic analysis of the hearts of myricetin-injected animals. (L) Decreased adenine+adenosine/uridine ratios in myricetin-injected animals (n = 3). (M) Metabolomic analysis of serum demonstrating decreased orotate and increased deoxyuridine (day 3) and increased orotidine (day 7) in myricetin-injected versus vehicle-injected animals (n = 3). Data are represented as mean ± SEM. **P < 0.01; *P < 0.05, ordinary 2-way ANOVA with Šidák’s multiple comparisons test (D) or 2-tailed Student’s t test (B, G, and I–M).

