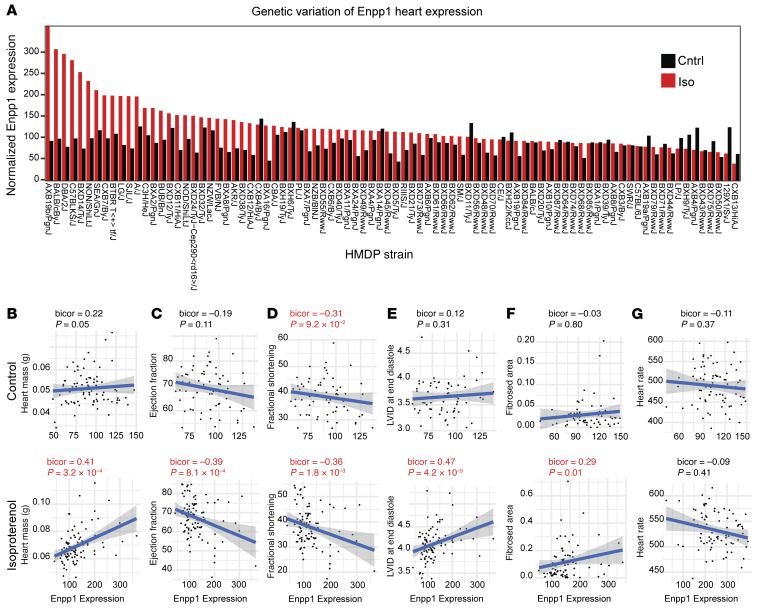
Figure 4. ENPP1 expression across 100 strains of mice correlates with cardiac function in an isoproterenol-induced cardiac injury model.
(A) Genetic variation of ENPP1 expression across 100 strains of mice following 3 weeks of isoproterenol or saline (control) infusion. (B–F) Cardiac traits of (B) cardiac mass, (C) EF, (D) fractional shortening, (E) LVID (diastole), and (F) fibrosis strongly correlating with ENPP1 expression across 100 strains of mice while (G) there is an absence of correlation with a trait such as heart rate. Data are shown as scatterplots. bicor, midweight bicorrelation coefficient and corresponding regression Student’s P value.

