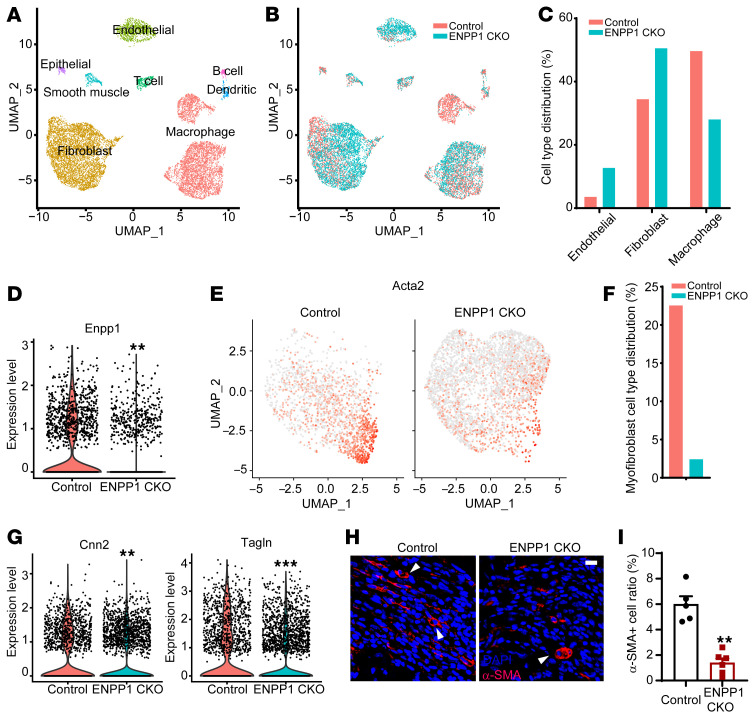
Figure 5. Single-cell RNA-Seq of nonmyocytes in control and ENPP1CKO animals at 7 days following cardiac injury.
(A) Uniform manifold approximation and projection (UMAP) demonstrating different phenotypes of nonmyocyte cell clusters in the injured heart and (B) distribution of WT and ENPP1CKO cells across these clusters. (C) Fraction of endothelial cell, fibroblasts, and macrophages at 7 days following injury. Violin plot demonstrating (D) ENPP1 expression (**P = 5.29 × 10–132) and (E) UMAP demonstrating significantly reduced distribution of Acta2 (myofibroblast marker) in CFs of ENPP1CKO versus control animals and (F) quantitation (%) of myofibroblasts. (G) Violin plot demonstrating decreased expression of other myofibroblast genes Cnn2 (**P = 3.63 × 10⁻²⁴) and Tagln (***P = 5.40 × 10⁻¹⁷) in ENPP1CKO fibroblasts. (H) Immunostaining for myofibroblasts (αSMA expression, arrowheads) in ENPP1CKO and WT animals and (I) quantitation of myofibroblast numbers. Data are represented as mean ± SEM. n = 5. **P < 0.01, 2-tailed Student’s t test. Scale bar: 10 μm.

