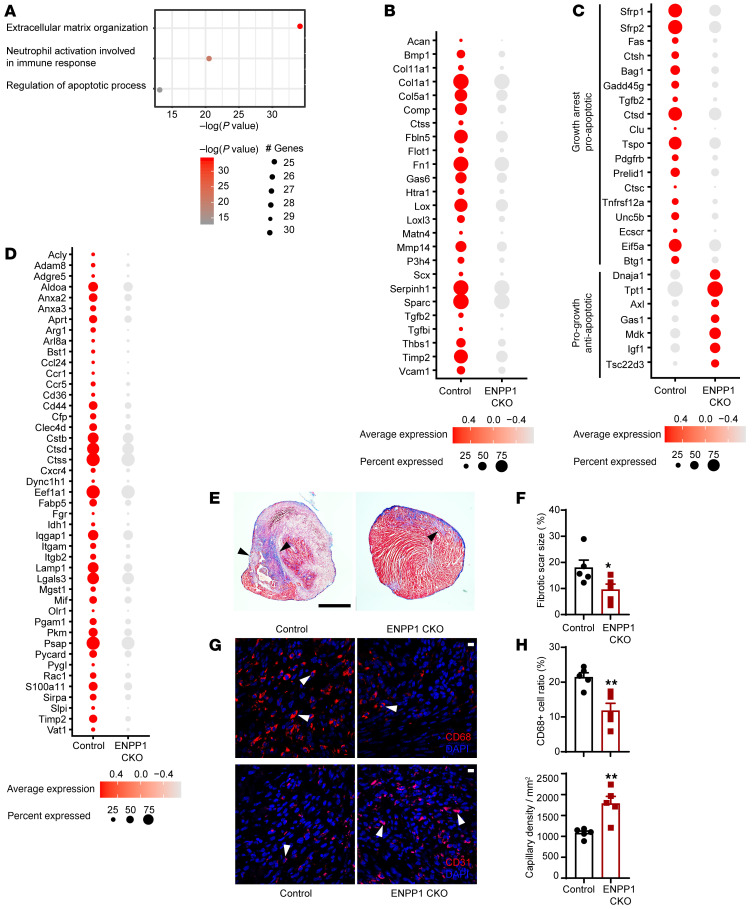
Figure 6. GO analysis of nonmyocyte single-cell RNA-Seq at 7 days following cardiac injury.
(A) GO analysis demonstrating principal pathways upregulated in CFs of control mice versus ENPP1CKO animals. (B) Dot plot demonstrating principal ECM genes upregulated in control versus ENPP1CKO CFs 7 days after cardiac injury. (C) Dot plot demonstrating differential expression of pro- and antiapoptotic genes in CFs at 7 days after injury. (D) Dot plot demonstrating differential expression of inflammatory genes in macrophages of control and ENPP1CKO hearts at 7 days after injury. (E) Masson trichrome staining showing expression of collagen (blue) in the apical region of hearts of mice at 7 days following injury and (F) quantitation of fibrotic scar (arrowheads) size at 7 days following injury (n = 5). Scale bar: 1 mm. (G) Immunofluorescent staining demonstrating CD68 (macrophages, arrowheads) and CD31 (endothelial, arrowheads) staining in control and ENPP1CKO animals at 7 days following injury and (H) quantitation of cells by histology (n = 5). Scale bars: 10 μm. Data are represented as mean ± SEM. **P < 0.01; *P < 0.05, 2-tailed Student’s t test (F and H).

