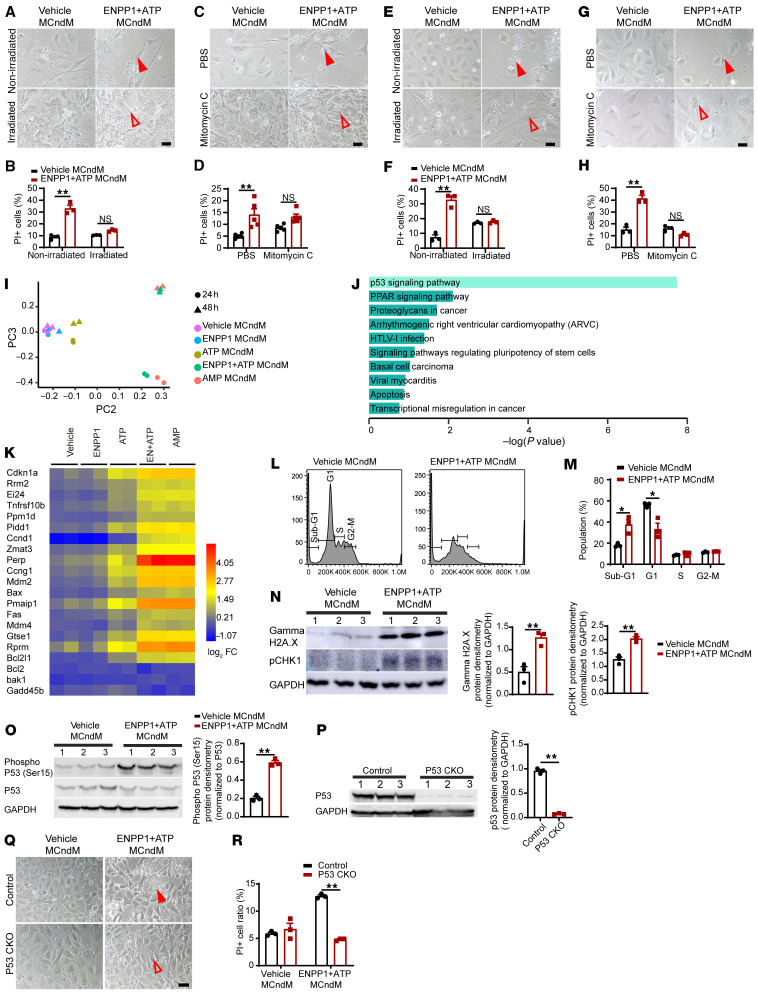
Figure 7. Proapoptotic molecules secreted by cardiomyocytes cause cell death only in cycling cells.
(A) Irradiated or nonirradiated CFs treated with vehicle or ENPP1+ATP MCndM for 48 hours. Cell death in irradiated but not in irradiated CFs (filled arrow) (B) Quantitation of cell death (n = 3). (C) PBS- or mitomycin C–treated CFs treated with vehicle or ENPP1+ATP MCndM for 48 hours; rescue of cell death with mitomycin (filled and unfilled arrowheads). (D) Quantitation of cell death (n = 5). Scale bar: 50 μm. (E–H) MEFs treated with vehicle or ENPP1+ATP MCndM following (E) irradiation or (G) mitomycin C. Rescue of cell death with irradiation or mitomycin C (filled and unfilled arrowheads) and (F and H) quantification of cell death following (F) irradiation (n = 3) or (H) mitomycin treatment (n = 3). Scale bars: 50 μm. (I) Principal component analysis of gene expression changes in CFs treated with ENPP1+ATP MCndM (n = 2). (J) GO analysis of main differentially expressed pathways in CFs following treatment with ENPP1+ATP MCndM. (K) Heatmap demonstrating expression of p53-driven apoptotic genes in CFs treated with ENPP1+ATP MCndM. (L) Cell-cycle analysis demonstrating G1/S phase arrest in CFs treated with ENPP1+ATP MCndM and (M) cells (%) in different phases of cell cycle (n = 3). (N) Western blot and quantitation for pH2A.X and pCHK-1 in CFs treated with ENPP1+ATP MCndM (n = 3). (O) Western blot and densitometry of p53 Ser15 phosphorylation in CFs treated with ENPP1+ ATP MCndM (n = 3). (P) p53 protein levels in p53CKO CFs (n = 3) (Q) p53CKO CFs treated with vehicle or ENPP1 MCndM demonstrating rescue of cell death in p53CKO CFs (filled and unfilled arrowheads) and (R) quantitation of cell death (n = 3). Scale bar: 50 μm. Data are represented as mean ± SEM. **P < 0.01; *P < 0.05, 2-tailed Student’s t test (B, D, F, H, M–P, and R).

