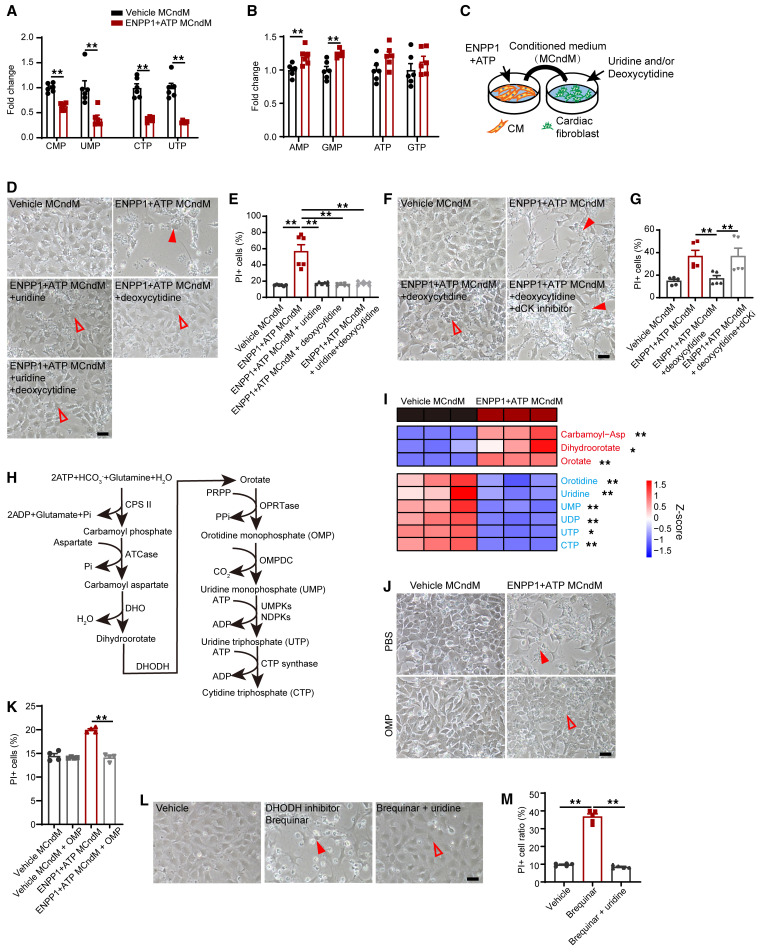
Figure 8. CFs treated with ENPP1+ATP (MCndM) exhibit decreased pyrimidine levels.
(A) LC/MS-MS demonstrating decreased levels of intracellular pyrimidine nucleotides but not (B) purine nucleotides in CFs treated with ENPP1+ATP MCndM (n = 6). (C) CFs treated with vehicle MCndM or ENPP1+ATP MCndM in the presence of uridine, deoxycytidine, or both demonstrating (D) cell death (arrowheads) in CFs treated with ENPP1+ATP MCndM, but rescue of cell death (unfilled arrowheads) following addition of uridine, deoxycytidine, or both. Scale bar: 50 μm. (E) Flow cytometry to demonstrate effects on cell death following addition of uridine or deoxycytidine to CFs treated with ENPP1+ATP MCndM (n = 6). (F) Effect of adding deoxycytidine and deoxycytidine kinase inhibitor (dCKi) to CFs treated with ENPP1+ATP MCndM is a loss of rescue of deoxycytidine in the presence of dCKi (unfilled and filled arrowheads) and (G) quantitation of cell death (n = 5). Scale bar: 50 μm. (H) Outline of critical steps of pyrimidine biosynthesis. (I) Heatmap demonstrating differential expression of metabolites in pyrimidine biosynthetic pathway between CFs treated with vehicle MCndM and those treated with ENPP1+ATP MCndM (n = 3). (J) Rescue of cell death following addition of OMP to CFs treated with ENPP1+ATP MCndM (filled and unfilled arrowheads) and (K) quantitation of cell death (n = 4). Scale bar: 50 μm. (L) Effect on cell death following addition of DHODH inhibitor brequinar (filled arrowheads) to disrupt pyrimidine biosynthesis and rescue with uridine (unfilled arrowheads). (M) Flow cytometry to determine effects of brequinar on cell death and rescue by uridine (n = 5). Scale bar: 50 μm. Data are represented as mean ± SEM.**P < 0.01; *P < 0.05, 2-tailed Student’s t test, (B, I) or ordinary 1-way ANOVA with Tukey’s multiple comparison test (E, G, K, and M).

