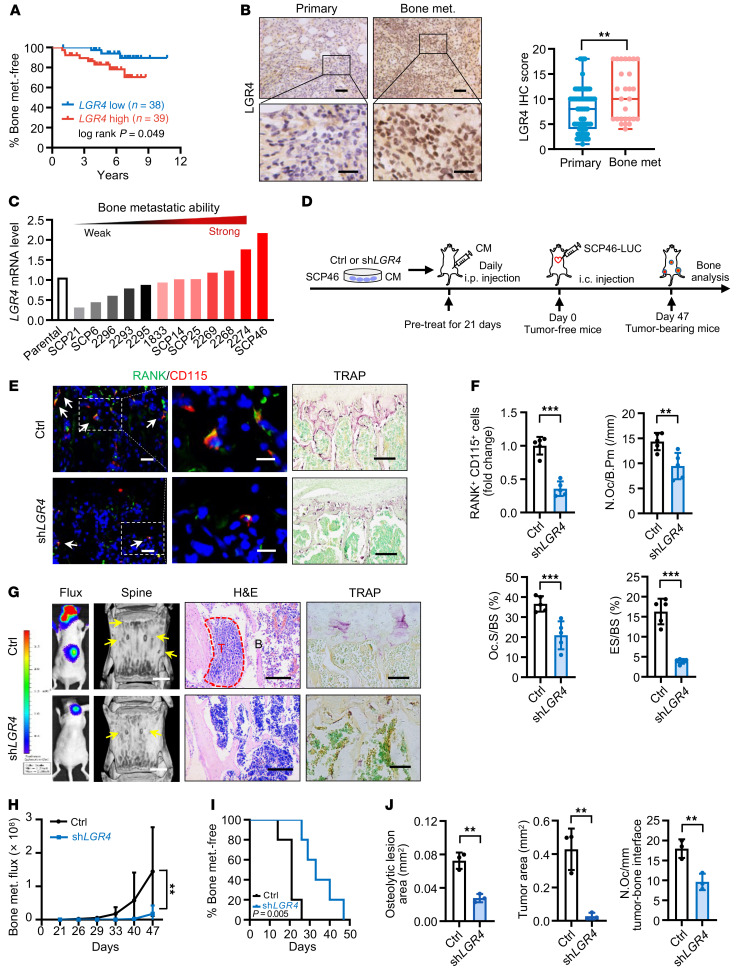
Figure 3. LGR4 contributed to OP recruitment and regulated osteoclastic premetastatic niche formation and bone metastasis.
(A) Kaplan-Meier analysis of bone metastasis–free survival according to LGR4 mRNA expression in BCa patients (GEO GSE2603; LGR4 low, n = 38; LGR4 high, n = 39). Log-rank test. (B) LGR4 IHC staining in BCa patient samples and quantitative analysis. Data indicate the mean ± SD. **P < 0.01, unpaired 2-tailed Student’s t test. Primary, n = 73; bone met., n = 27. Scale bars: 50 μm/20 μm (top/bottom). (C) LGR4 expression was correlated with bone metastatic capability in MDA231 sublines with distinct bone-metastasis abilities (GEO GSE14244 and GSE16554). (D) Experimental design of the in vivo premetastatic niche mouse model. Conditioned medium from LGR4-knockdown SCP46 cells was collected and injected i.p. into nude mice every day for 21 days of pretreatment (tumor-free mice); SCP46-LUC cells were injected i.c. into mice (day 0). Forty-seven days after i.c. injection, bones of mice (tumor-bearing mice) were analyzed. (E and F) Representative images of IF double staining for RANK (green) and CD115 (red) and TRAP staining in the L3 spines of tumor-free mice (E), and quantitative analysis (F). White arrows, double-positive for RANK and CD115. Data indicate the mean ± SD. **P < 0.01, ***P < 0.001, unpaired 2-tailed Student’s t test, n = 5. Scale bars: 10 μm/5 μm (left/right, IF), 50 μm (TRAP). (G–J) Representative images of bioluminescent, radiographic, H&E, and TRAP staining in the L3 spines of tumor-bearing mice (G), and quantitative analysis (H–J). Yellow arrows, osteolytic lesions; red dotted lines, tumor zone. Data indicate the mean ± SD. **P < 0.01, (H) 2-way ANOVA, (I) log-rank test, n = 5 (H and I); (J) unpaired 2-tailed Student’s t test, n = 3. Scale bars: 1 mm (micro-CT), 200 μm (H&E), 30 μm (TRAP).

