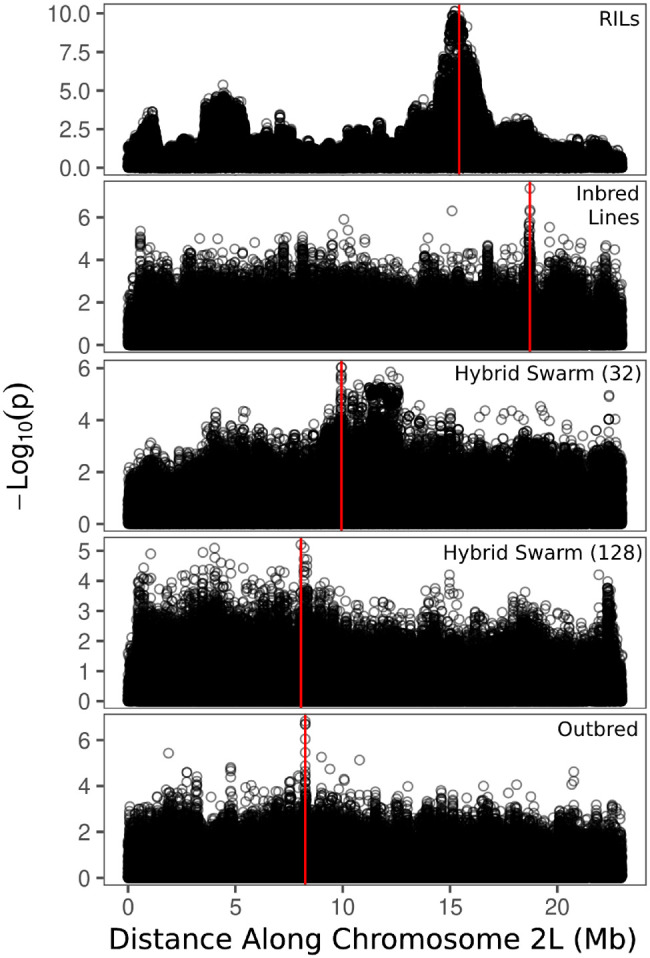
Figure 4.

Examples of Manhattan plots from our simulated GWAS. These simulations correspond to a single causal locus of large effect, with position indicated by the vertical red line. Recombinant Inbred Lines tend to display a wide association peak near the causal locus, while other populations show only a small number of sites tightly clustered on the causal locus.
