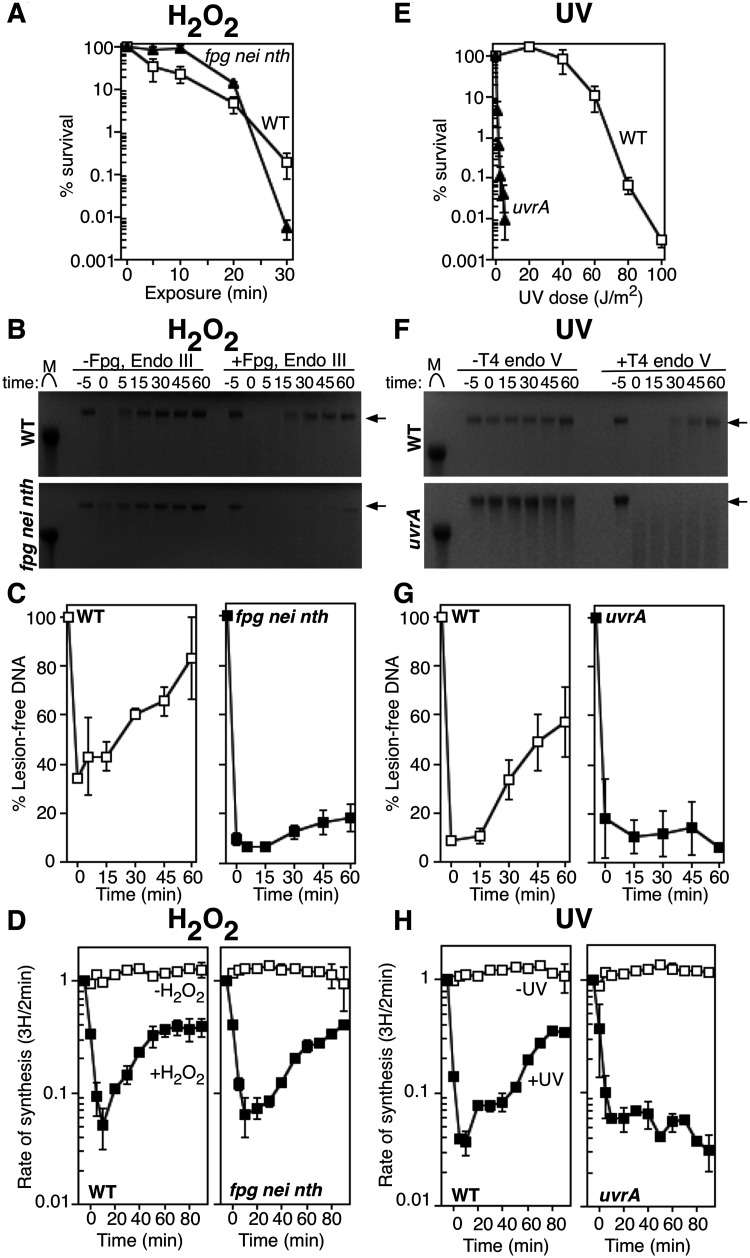
Figure 1.
DNA replication recovers even in the absence of lesion removal following H2O2 treatment, but not UV irradiation. (A) The survival of wild-type (open squares) and fpg nei nth (filled triangles) cells following 10 mM H2O2 treatment is plotted. Graphs represent the average of three independent experiments. Error bars represent one standard error of the mean. (B) Wild-type (top) and fpg nei nth (bottom) cultures were treated with 10 mM H2O2 for 5 min, allowed to recover and then genomic DNA was purified at the indicated times. DNA was either treated with Fpg and Endo III (+Fpg, Endo III), or no glycosylase (untreated) for 1 h at 37°C and then analyzed on alkali agarose gels. A representative gel is shown. Arrows indicate lesion-free DNA. (C) The percentage of lesion-free, high-molecular-weight DNA in Fpg/Endo III-treated samples is plotted for each time point relative to mock-treated samples. Graphs represent an average of at least two independent experiments. (D) [3H]thymidine was added to cultures grown with manganese for 2 min at the indicated times following H2O2 treatment at time zero. The rate of DNA synthesis (3H/2 min) relative to the amount incorporated immediately prior to exposure is plotted for wild-type and fpg nei nth cultures exposed to mock treatment (open symbols) or 10 mM H2O2 for 5 min (filled symbols). Graphs represent an average of at least two independent experiments. Error bars represent one standard error of the mean. (E) The survival of wild-type (open squares) and uvrA (filled triangles) cells following UV irradiation is plotted. Graphs represent the average of three independent experiments. Error bars represent one standard error of the mean. (F) Wild-type (top) and uvrA (bottom) cultures were UV irradiated at 50 J/m2, then genomic DNA was purified at the indicated times and either treated with T4 endonuclease V (+T4 endo V) or no T4 endo V (untreated) for 1 h at 37°C and analyzed on alkali agarose gels. A representative gel is shown. Arrows indicate lesion-free DNA. (G) The percentage of lesion-free, high-molecular-weight DNA in T4 Endo V-treated samples is plotted for each time point relative to mock-treated samples. Graphs represent an average of at least two independent experiments. H) [3H]thymidine was added to cultures grown with manganese for 2 min at the indicated times following UV irradiation at time zero. The rate of DNA synthesis (3H/2 min) relative to the amount incorporated immediately prior to exposure is plotted for wild-type and uvrA cells exposed to mock treatment (open symbols) or 50 J/m2 UV irradiation (filled symbols) treatment. Graphs represent an average of at least two independent experiments. Error bars represent one standard error of the mean.

