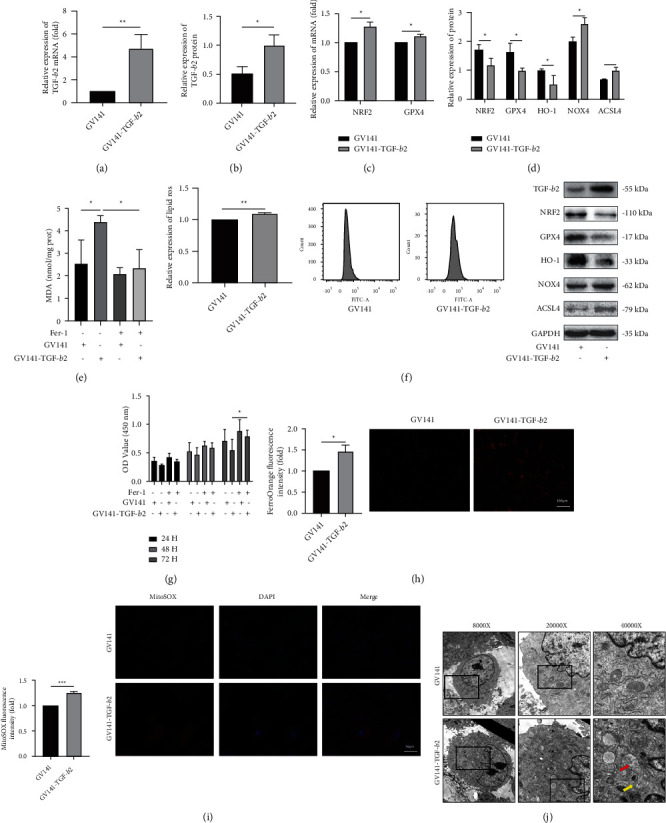
Figure 3.

Effect of TGF-β2 on ferroptosis in H9c2 cells. (a, b) The mRNA and protein levels of TGF-β2 in H9c2 cells (n = 3). (c) The mRNA levels of NRF2 and GPX4 in H9C2 cells. (d) The protein levels of NRF2, GPX4, HO-1, NOX4, and ACSL4 in H9C2 cells. (e–i) The MDA levels, lipid ROS levels, cell viability, Fe2+ concentrations, and mitochondrial ROS in H9c2 cells. (j) The ultrastructural morphology of H9c2 cells was detected by transmission electron microscopy. The red arrow shows vacuolization of mitochondria; the yellow arrow shows rupture of the outer mitochondrial membrane. In all panels, the data are representative of three independent experiments. The data are presented as the mean ± SD. Statistical significance is shown as ∗P < 0.05 vs. controls, ∗∗P < 0.01 vs. controls, and ∗∗∗P < 0.001 vs. controls.
