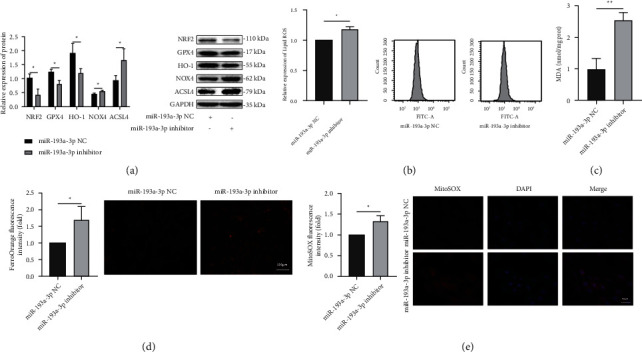
Figure 5.

Effect of miR-193a-3p on ferroptosis in H9c2 cells. (a) The protein expression of NRF2, GPX4, HO-1, NOX4, and ACSL4 in H9C2 cells (n = 3). (b–e) The lipid ROS levels, MDA levels, Fe2+ concentrations, and mitochondrial ROS levels in H9c2 cells. In all panels, the data are representative of three independent experiments. The data are presented as the mean ± SD. Statistical significance is shown as ∗P < 0.05 vs. controls, ∗∗P < 0.01 vs. controls, and ∗∗∗P < 0.001 vs. controls.
