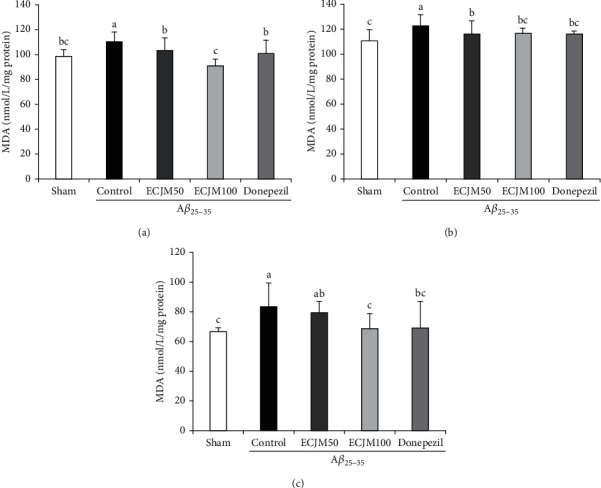
Figure 6.

Effect of ECJM on Aβ25-35-induced lipid peroxidation in the brain (a), liver (b), and kidney (c). (1) Sham group: injection of 0.9% NaCl and oral administration of water. (2) Control group: injection of Aβ25-35 and oral administration of water. (3) ECJM50 group: injection of Aβ25-35 and oral administration of ECJM (50 mg/kg/day). (4) ECJM100 group: injection of Aβ25-35 and oral administration of ECJM (100 mg/kg/day). (5) Donepezil group: injection of Aβ25-35 and oral administration of donepezil (5 mg/kg/day). Values are the mean ± SD. One-way ANOVA was used to compare the mean values of groups, followed by Duncan's multiple-range test post hoc. Different alphabet letters (a, b, and c) indicate statistically significant difference (P < 0.05). Mean values with the same letter are not significantly different.
