
Figure 2.
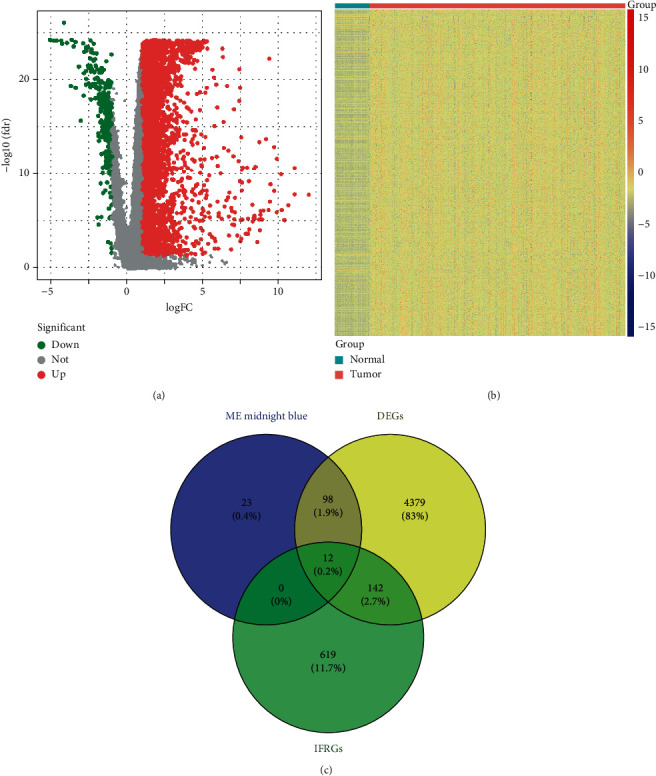
Identification of crucial IFRGs in HCC from the TCGA database. (a) Volcano plot and (b) heat map presented the levels of expression of DEGs between normal tissues and HCC. (c) Venn diagram showing the overlapping genes among HCC-related genes, DEGs, and IFRGs.