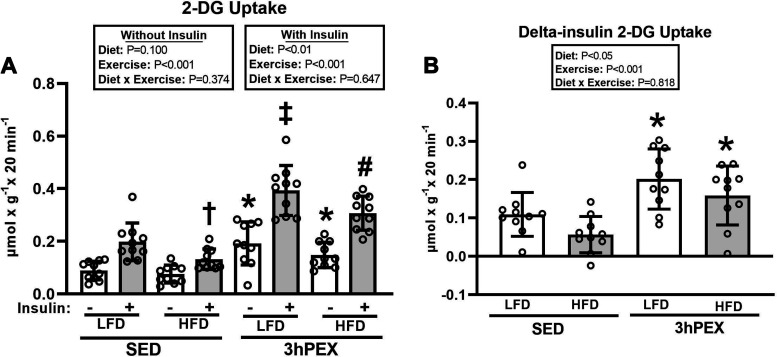
Figure 3.
A: 2-deoxy-D-glucose (2-DG) uptake in paired epitrochlearis muscles incubated ± 100 µU/mL insulin at 3 h postexercise (3hPEX). With no insulin: *3hPEX vs. sedentary (SED) within each diet [P < 0.001 for low-fat diet (LFD) group; P < 0.05 for high-fat diet (HFD) group]. With insulin: †HFD-SED < LFD-SED (P < 0.05); ‡LFD-3hPEX > LFD-SED (P < 0.001) and HFD-3hPEX (P < 0.01); #HFD-3hPEX > HFD-SED (P < 0.001). B: delta-insulin 2-DG uptake values (delta = value with insulin − value without insulin from paired muscles). *3hPEX vs. SED within each diet (P < 0.01). Data were analyzed by 2-way analysis of variance within each insulin level (without or with insulin) or for delta-insulin values. Tukey post hoc analysis was performed to identify significant differences. Values are means ± SD; n = 10 rats per treatment group.

