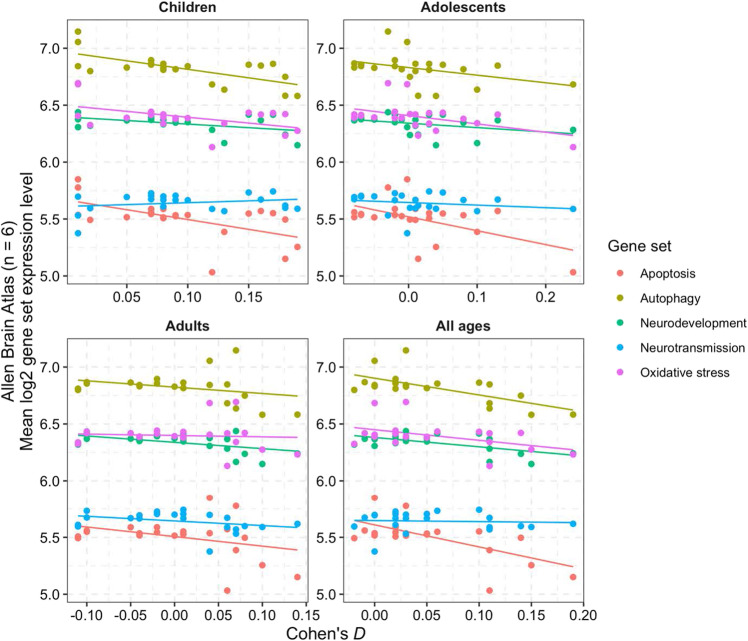
Fig. 3. Scatterplots and best-fit regression lines show correlations between brain size differences in ADHD cases across 22 brain regions (x-axis, Cohen’s d) with gene-set expression levels (y-axis).
Cohen’s d effect sizes were stratified according to the age groups described by the ENIGMA-ADHD working group in their case-control analyses of subcortical and cortical brain MRI data. Dots are color coded by gene set. Table 1 gives the statistical significance of these correlations.

