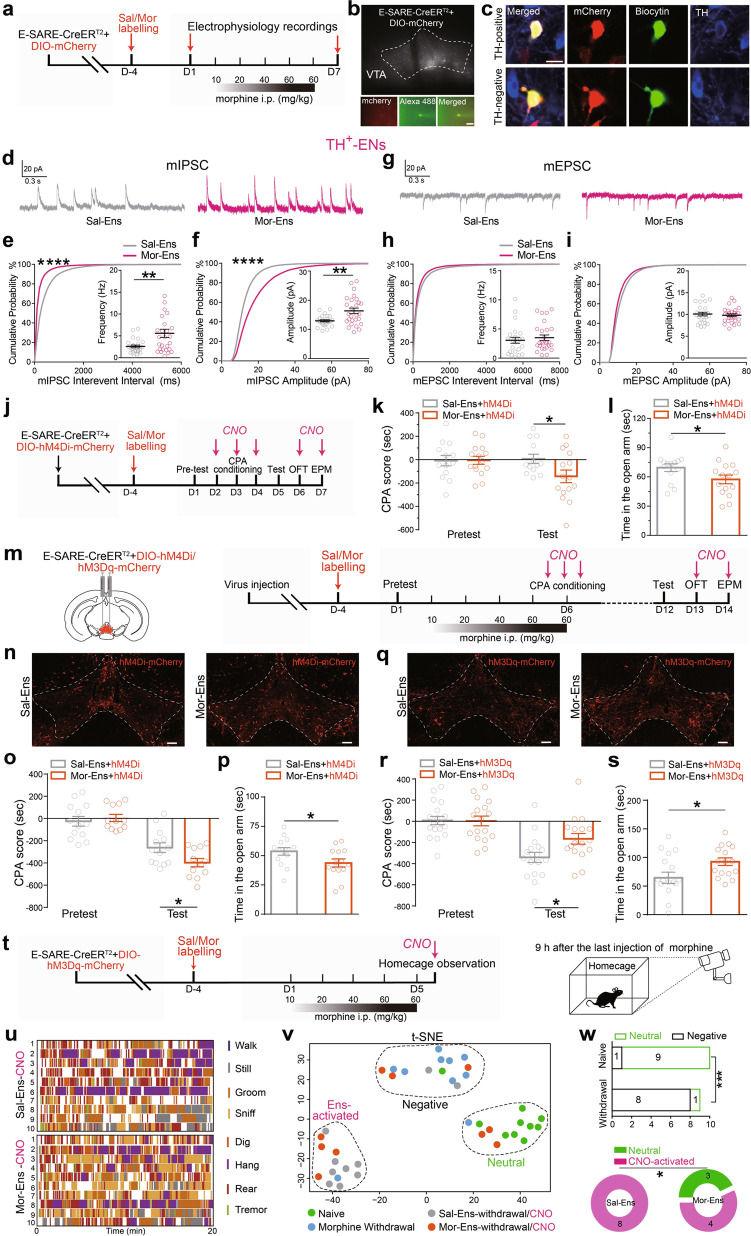
Fig. 2. The inhibitory transmission in dopaminergic Mor-Ens is enhanced and this is required for the development of negative effect during opiate withdrawal.
a Experimental scheme of the VTA ensembles recording before (day 1), or after the escalating dose of morphine treatment (day 7). b Representative images of neurons for the recordings in the VTA and the neuron filled with dye. Scale bar, 20 μm. c Mor-Ens or Sal-Ens were injected with biocytin, and costained with anti-TH antibody after recording. Red: mCherry; Green: biocytin; Blue: TH. Scale bar, 10 μm. d Representative traces of mIPSCs. e, f Cumulative probability distribution and average amplitude and frequency of mIPSCs recorded from TH+ VTA ensembles after escalating-dose of morphine administration. g Representative traces of mEPSCs. h, i Cumulative probability distribution and average amplitude and frequency of mEPSCs recorded from TH+ VTA ensembles after escalating dose of morphine administration. Sal-Ens: 9 mice, Mor-Ens: 11 mice. Unpaired t test, frequency: t = 2.864, df = 49, P = 0.0061 in (e), amplitude: t = 3.237, df = 49, P = 0.0022 in (f); Mann–Whitney U test, frequency: U = 291, P = 0.5429 in (h), amplitude: U = 311, P = 0.8151 in (i); two-sample Kolmogorov–Smirnov (KS) test for cumulative probability distribution, interval: P < 0.0001 in (e), amplitude: P < 0.0001 in (f). j–l Schematic representation of the virus injection and behavioral tests in mice without withdrawal. The effect of inhibition of Mor-Ens in the VTA on CPA and anxiety (j). Quantification of CPA score in hM4Di groups (k). Two-way RM ANOVA, Fgroups × session (1, 26) = 5.342, P = 0.0290, Sal-Ens vs Mor-Ens within test, P = 0.0397. (l) Quantification of the time in open arm in hM4Di groups without withdrawal. Mann–Whitney U test, U = 58, P = 0.0411. m Experimental process of the virus injection and behavioral tests after the ensemble labeling in withdrawal mice. n–p The effect of inhibition of Mor-Ens on morphine-withdrawal-induced CPA and anxiety. Representative images of expression of hM4Di-mCherry in VTA Sal-Ens and Mor-Ens (n). Scale bar, 100 μm. Quantification of morphine-withdrawal-induced CPA score in hM4Di groups (o). Two-way RM ANOVA, Fgroups × session (1, 23) = 7.248, P = 0.013, Sal-Ens vs Mor-Ens within test, P = 0.0429. Quantification of the time in open arm in hM4Di groups (p). Mann–Whitney U test, U = 52, P = 0.0350. q–s The effect of activation of Mor-Ens on morphine-withdrawal-induced CPA and anxiety. Representative images of expression of hM3Dq-mCherry in VTA Sal-Ens and Mor-Ens (q). Scale bar, 100 μm. Quantification of morphine-withdrawal-induced CPA score in hM3Dq groups (r). Two-way RM ANOVA, Fgroups × session (1, 33) = 5.125, P = 0.0303, Sal-Ens vs Mor-Ens within test, P = 0.0170. Quantification of the time in open arm in hM3Dq groups (s). Mann–Whitney U test, U = 73, P = 0.0387. t Experimental process of virus injection and 20-min behavioral recording in the home cages. u Analysis of the eight behaviors in mice that activation of Sal-Ens and Mor-Ens during the spontaneous withdrawal period. Each column represents individual behavior. Each row represents one mouse. v t-Distributed stochastic neighbor embedding (t-SNE) representation of 40 mice behavioral patterns showing three clusters: negative (black), neutral (green), and chemo-activated (magenta). w Top: Proportion of mice displaying neutral or negative pattern. Bottom: Proportion of CNO-treated mice displaying neutral pattern. Top, χ2 test, P = 0.0006; Bottom, χ2 test, P = 0.0384. *P < 0.05, **P < 0.01, ***P < 0.001, ****P < 0.0001. Data are presented as mean ± SEM.

