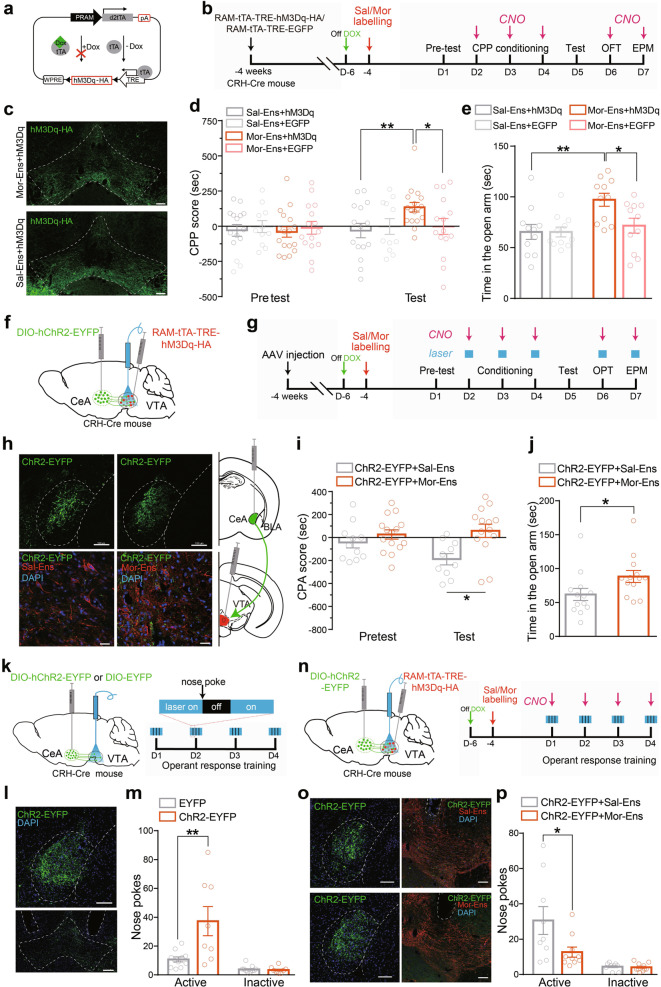
Fig. 5. Chemogenetic activation of Mor-Ens in VTA alleviates the negative effect induced by activating CRHCeA→VTA terminals.
a Schematic representation of AAV-RAM-tTA-TRE-hM3Dq vector. b Experimental process of the CNO-evoked CPP experiment. c Representative images of expression of hM3Dq-HA in VTA Sal-Ens and Mor-Ens. Scale bar, 100 μm. d, e Chemoactivation of Mor-Ens drives CPP and promotes anxiolytic behavior. Two-way RM ANOVA, Fgroups × session (1, 38) = 7.365, P = 0.011, Sal-Ens+hM3Dq vs Mor-Ens+hM3Dq within test, P = 0.006; Fgroups × session (1, 30) = 4.917, P = 0.034, Mor-Ens+hM3Dq vs Mor-Ens+EGFP within test, P = 0.029; Fgroups × session (1, 24) = 0.0006, P = 0.9799, Sal-Ens+hM3Dq vs Sal-Ens+EGFP within test, P > 0.999 in (d). Mann–Whitney test, Sal-Ens+hM3Dq vs Mor-Ens+hM3Dq, U = 20, P = 0.0065; Mor-Ens+hM3Dq vs Mor-Ens+EGFP, U = 26, P = 0.0233; Sal-Ens+hM3Dq vs Sal-Ens+EGFP, U = 60, P = 0.9851 in (e). f Schematic representation of virus injection and optic-fiber implantation in the VTA. g Experimental process of the opto- and chemogenetic manipulated behavioral tests. h Representative images of CRH neurons in the CeA expressing hChR2-EYFP (top), and Sal-Ens or Mor-Ens in the VTA labeled with hM3Dq-HA (bottom). Green: EYFP; Red: HA; Blue: DAPI. Scale bars, top: 100 µm; bottom: 20 μm. i, j The effect of chemogenetic activation of Mor-Ens and optogenetic activation of CRHCeA→VTA terminals on the CPA and EPM tests. Two-way RM ANOVA, Fgroups × session (1, 24) = 2.257, P = 0.146, hChR2+Sal-Ens vs hChR2+Mor-Ens within test, P = 0.010 in (i); Mann–Whitney test, U = 37, P = 0.014 in (j). k Left: Schematic representation of virus injection and optic-fiber implantation in the VTA for negative reinforcement task. Right: Experimental process of the operant response training. l Representative images of ChR2-EYFP expression in CeA and the projective terminals in the VTA. The dashed white lines indicated the optic fiber trace. Green: EYFP, Scale bars, 100 µm. m Average number of nose pokes in 60-min session on day 4. Unpaired t test, t = 3.026, df = 17, P = 0.0076. In total, 8–11 mice/group. n Left: Schematic representation of virus injection and optic-fiber implantation in the VTA for negative-reinforcement task. Right: Experimental process of the optical and chemogenetic manipulated operant-response training. o Representative images of ChR2-EYFP in CeA, and hM3Dq-HA in VTA. The dashed white lines indicated the optic-fiber trace. Green: EYFP; Red: HA; Blue: DAPI. Scale bars, 100 µm. p Average number of nose pokes in 60-min session on day 4. Unpaired t test, t = 2.215, df = 17, P = 0.0407. In total, 9–10 mice/group. *P < 0.05, **P < 0.001. Data are presented as mean ± SEM.

