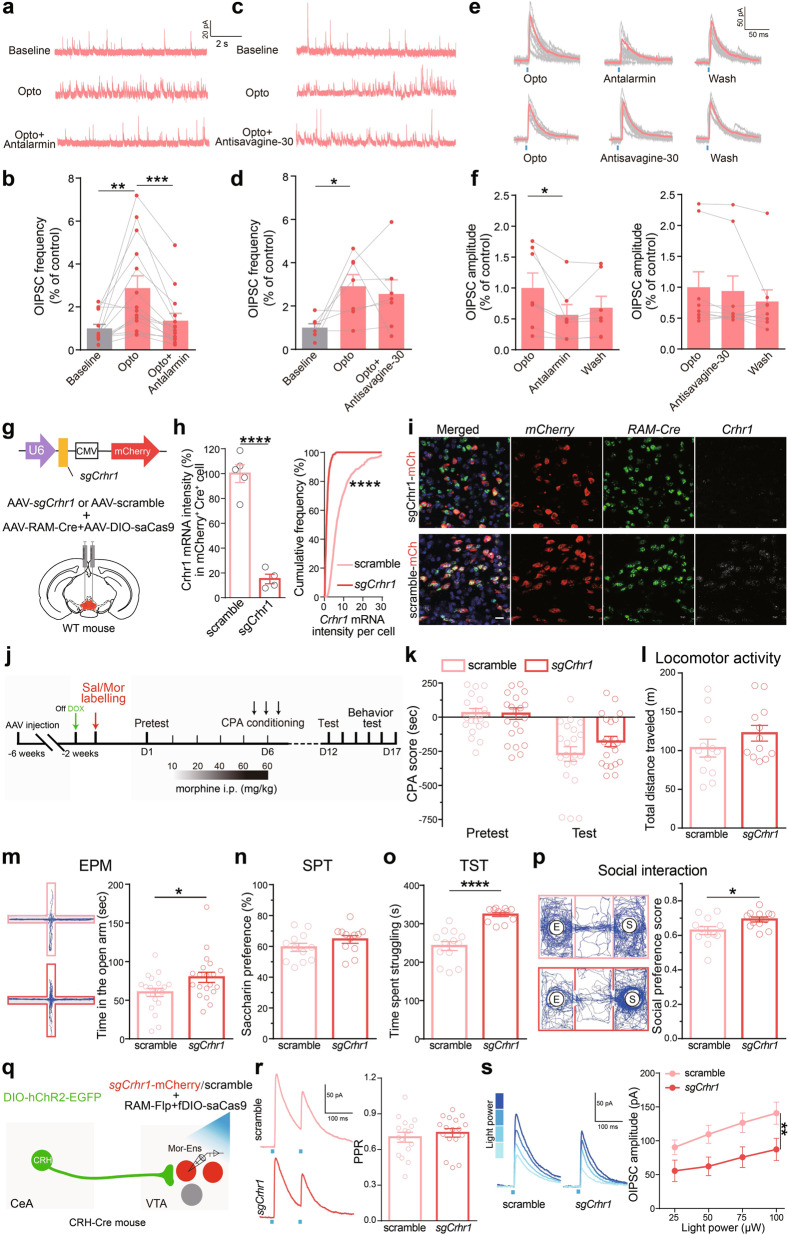
Fig. 6. Pharmacological and genetic interventions of CRHR1 signaling attenuate the inhibitory inputs from CRHCeA→VTA, and the negative effect during opiate withdrawal.
a–d Representative traces (a, c) and quantification of the IPSC frequency (b, d) in Mor-Ens following optical stimulation in the presence of antalarmin or antisavagine-30. Paired t test, Baseline vs Opto, t = 3.493, df = 13, P = 0.0044; Opto vs antalarmin, t = 4.482, df = 13, P = 0.0006 in (b). Baseline vs Opto, t = 2.909, df = 6, P = 0.0207; Opto vs antisavagine-30, t = 0.5294, df = 6, P = 0.6155 in (d). e, f Representative traces (e) and quantification of O-IPSC amplitudes (f) in Mor-Ens in the presence of antalarmin or antisavagine-30. Paired t test, Opto vs antalarmin, t = 2.920, df = 6, P = 0.0266; Opto vs antisavagine-30, t = 1.973, df = 8, P = 0.0840. g Schematic representation of the virus injection. h Quantification of the fluorescent intensity of Crhr1 mRNA in mCherry+Cre+ cells. sgCrhr1: 419 cells from 4 mice; scramble: 596 cells from 5 mice. Unpaired t test, t = 9.632, df = 7, P < 0.0001; Two-sample KS test, P < 0.0001. i Representative images of Crhr1, Cre, and mCherry ISH probes in sgCrhr1 or scramble groups. Blue: DAPI; Green: Cre; Red: mCherry; Gray: Crhr1. Scale bar, 20 μm. j–p The effect of deletion of Crhr1 in Mor-Ens on negative effect during morphine withdrawal. Experimental process of the behavioral assays (j). Morphine-withdrawal-induced CPA test (k), locomotor activity (l), EPM (m), SPT (n), TST (o), and social-interaction test (p). Two-way RM ANOVA, Fgroups × session (1, 41) = 1.677, P = 0.2025, scramble vs sgCrhr1 within test, P = 0.203 in (k). Mann–Whitney test or unpaired t test, scramble vs sgCrhr1, (l): U = 51, P = 0.2415; (m): U = 126, P = 0.0460; (n): U = 47, P = 0.1600; (o): t = 6.212, df = 23, P < 0.0001; (p): U = 36, P = 0.0387. q Schematic representation of optical stimulation and ensemble recordings. r Representative traces of PPR in response to optical stimulation (473 nm, 2-ms pulse width at 100-ms interval) and quantification of PPR values in sgCrhr1 and scramble groups. Unpaired t test, t = 0.5813, df = 30, P = 0.5654. s Representative traces and quantification of the amplitudes of OIPSCs in Mor-Ens in response to different laser intensities (n = 16 neurons from five mice in sgCrhr1 group, n = 16 neurons from six mice in scramble group). Two-way ANOVA, F(3, 124) = 3.967, P = 0.0097. *P < 0.05, **P < 0.01, ***P < 0.001, ****P < 0.0001. Data are presented as mean ± SEM.

