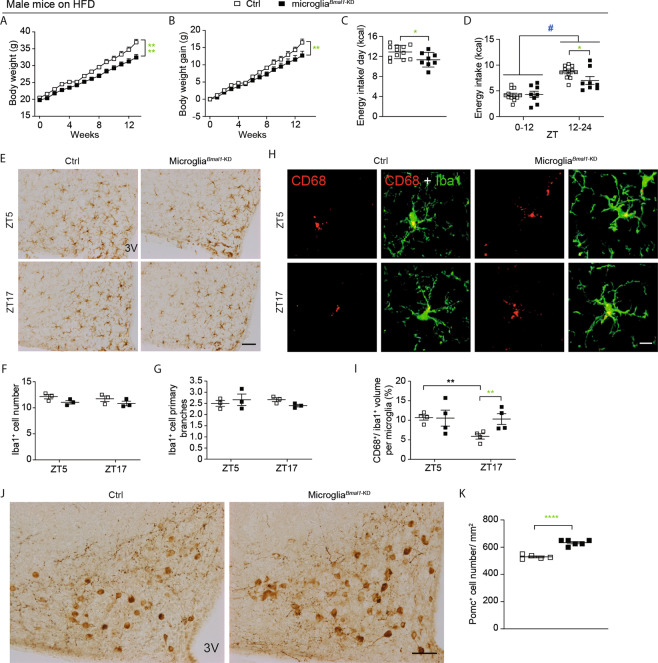
Fig. 2. Functional and cellular impact of microglial Bmal1 deletion on HFD-induced obesity in male mice.
A Absolute body weight and B body weight gain of Ctrl and microgliaBmal1-KD mice fed a HFD (n = 5–7 mice per group). C Energy intake per day and D energy intake during light (ZT0–12) and dark phases (ZT12–24; n = 8–12 mice per group). E Representative images of Iba1 immunostaining in the ARC; 3 V, third ventricle. Scale bar, 100 µm. F Quantification of Iba1+ microglial cells and G Iba1+ primary branches (n = 2–3 mice per group). H Confocal images of CD68 and Iba1 immunostaining in the ARC; scale bar, 10 µm. I Quantitative analysis of the volume percentage associated with CD68+ microglia in the ARC (n = 4–5 mice per group; 100–125 cells were analyzed in each group). J Images of POMC+ neurons in the ARC; 3 V, third ventricle, scale bar, 100 µm. K Analysis of POMC+ neurons expression (n = 5–6 mice per group). Data are presented as means ± s.e.m. Green-colored * indicates a genotype effect. *P < 0.05, **P < 0.01, ****P < 0.0001, and #P < 0.05 for ZT0–12 vs. ZT12–24.

