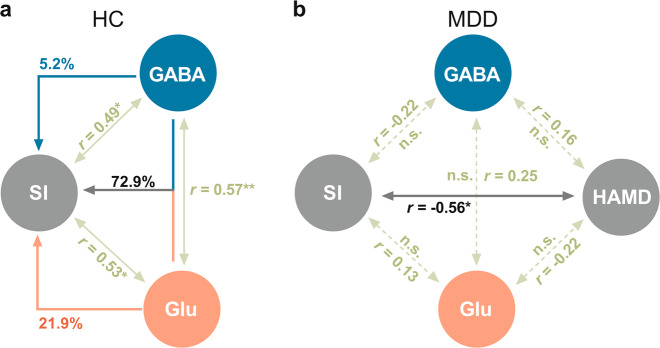
Fig. 4. Summary and detailed analyze the influences of GABA and Glu concentrations on the behavioral scores (SI and HAMD).
a Summary the significant correlations among SI, GABA and Glu concentrations in HC group. Furthermore, hierarchical regression model presents that the SI explained by the concentrations of GABA and Glu: 72.9% of SI variance was explained by conjoint GABA and Glu concentrations, 21.9% was uniquely explained by Glu concentration alone, and 5.2% by GABA concentration alone. b Summary the correlations among SI, HAMD, GABA and Glu concentrations in MDD group. There is only a significant negative correlation between motion SI and HAMD, no other significant correlations among the four variables.

