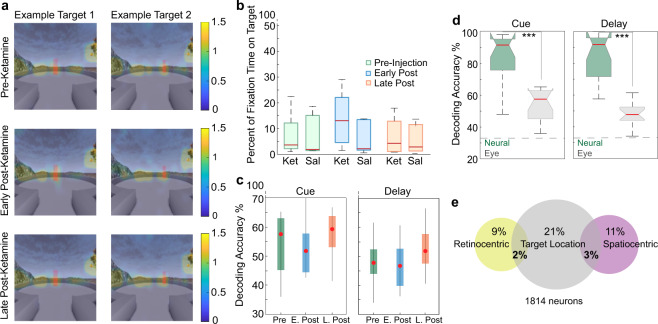
Fig. 5. Effect of ketamine on gaze behavior.
a Heat maps indicating eye fixation locations for two example target locations during the different injection periods. b Proportion of fixation time falling on the target location compared to all fixation time during the delay epoch for ketamine and saline sessions. c Comparison of decoding accuracy for target locations using eye fixation position between pre, early, and late- post ketamine-injection periods for the cue and delay epochs. d Comparison between decoding target location accuracy using neuronal ensemble activity (green) and eye fixation position on screen (gray) during the ketamine pre-injection period for the cue and delay epochs. e Proportion of single units tuned for target location during the delay epoch and tuned for saccade position in retinocentric or spatiocentric reference frames. Red center lines indicate median, the bottom and top edges of the box indicate the 25th and 75th percentiles. The whiskers extend to non-outlier data points (approximately within 2.7 std) and the outliers are plotted using ‘+’. *<0.05, **<0.01, ***<0.001.

