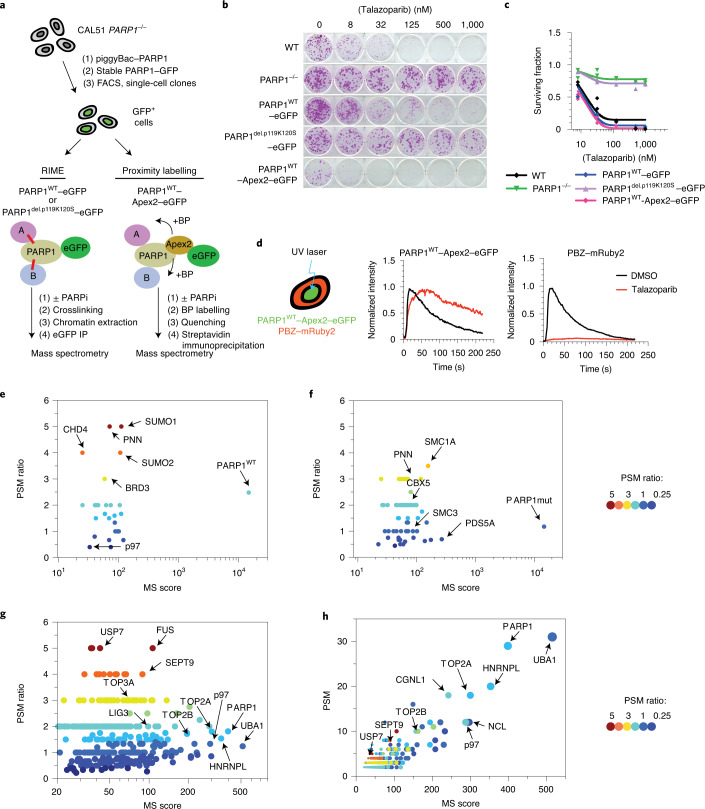
Fig. 1. Identification of trapped PARP1-interacting proteins.
a, Schematic describing the identification of trapped PARP1 protein–protein interactomes via RIME or proximity labelling linked to mass spectrometry. The cells were exposed to either PARPi + MMS (to enable trapping) or MMS (no trapping) for 1 h, after which PARP1-interacting/proximal proteins were identified by mass spectrometry analysis. BP, biotin-phenol. b, Clonogenic assay illustrating the restoration of PARPi sensitivity in the complemented PARP1–/– CAL51 cells as described in a. PARP1 protein expression in the different clones is shown in Extended Data Fig. 1a. c, Quantification of the colony formation assay shown in b; data are the mean of two biological replicates. d, PARP1WT–Apex2–eGFP protein localizes to sites of DNA damage, generates PAR and can be trapped by PARPi. Cells expressing PARP1WT–Apex2–eGFP were transfected with a PAR sensor, a PBZ PAR-binding domain fused to mRuby2 (left). PARP1WT–Apex2–eGFP and PBZ–mRuby2 accumulate at the sites of UV micro-irradiation. Exposure to 100 nM talazoparib causes sustained accumulation of PARP1WT–Apex2–eGFP (middle) but abolishes PAR production (right). Data represent two independent experiments with similar results. DMSO, dimethylsulfoxide. e,f, PARP1 interactions that are enriched under PARP1-trapping conditions (as defined by the PSM ratio ((talazoparib + MMS) ÷ MMS) and MS scores). Scatter plots are shown for PARP1WT–eGFP (e) and PARP1del.p.119K120S–eGFP (f) RIME. g, PARP1 interactions that are enriched under PARP1-trapping conditions for PARP1WT–Apex2–eGFP proximity labelling. RIME and proximity labelling were performed in three independent experiments. h, A graph plotting the PSM against MS score for PARP1WT–Apex2–eGFP proximity labelling interactions shows that p97 is among the most abundant proteins identified in the PARP1WT–Apex2–eGFP proximity labelling.

