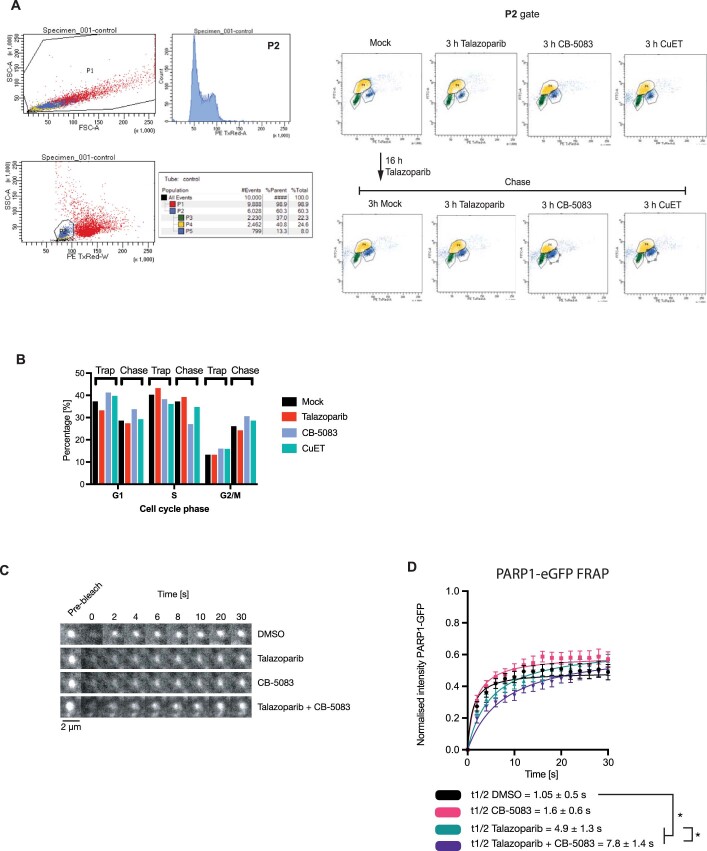
Extended Data Fig. 8. Cell cycle and ‘PARP1 exchange’ under p97 inhibition.
a. Cell cycle profiling for the experiment shown in Fig. 5i. CAL51 cells were exposed to drugs as shown. One hour prior to fixation, 10 μM EdU was added to the media. EdU was stained by a click reaction with Alexa488-azide and DNA was stained by propidium iodide. b. A quantification of the G1, S and G2 populations from (A). c, d. CAL51 PARP1WT-eGFP cells were subjected to UV-micro-irradiation, accumulation of PARP1WT-eGFP at UV-laser induced DNA damage sites was monitored in the presence of DMSO (vehicle), talazoparib, CB-5083 or in combination. At the maximum time of PARP1WT-eGFP recruitment (typically 1 min after micro-irradiation) the focus was bleached with a 488 nm laser and recovery of PARP1WT-eGFP was monitored over time as described in39. e. Image montages of the micro-irradiation site for (L). Scale bar = 2 µm. l. A quantification of the FRAP described in (K). The fluorescent signal was scaled according to the maximum PARP1WT-eGFP immediately prior the photobleach to (equalling 1) and the signal immediately after photobleach (0), as in39. The FRAP data was fitted with one site-specific binding model of non-linear regression and the extra sum of squares F test was used to calculate the t1/2. The significance was determined with a two-sided t-test from two independent experiments, where 10 to 12 cells were quantified for each condition. * - p-value < 0.05.

