
Figure 4. 4-HNE immunohistochemistry of MTP articular cartilage.
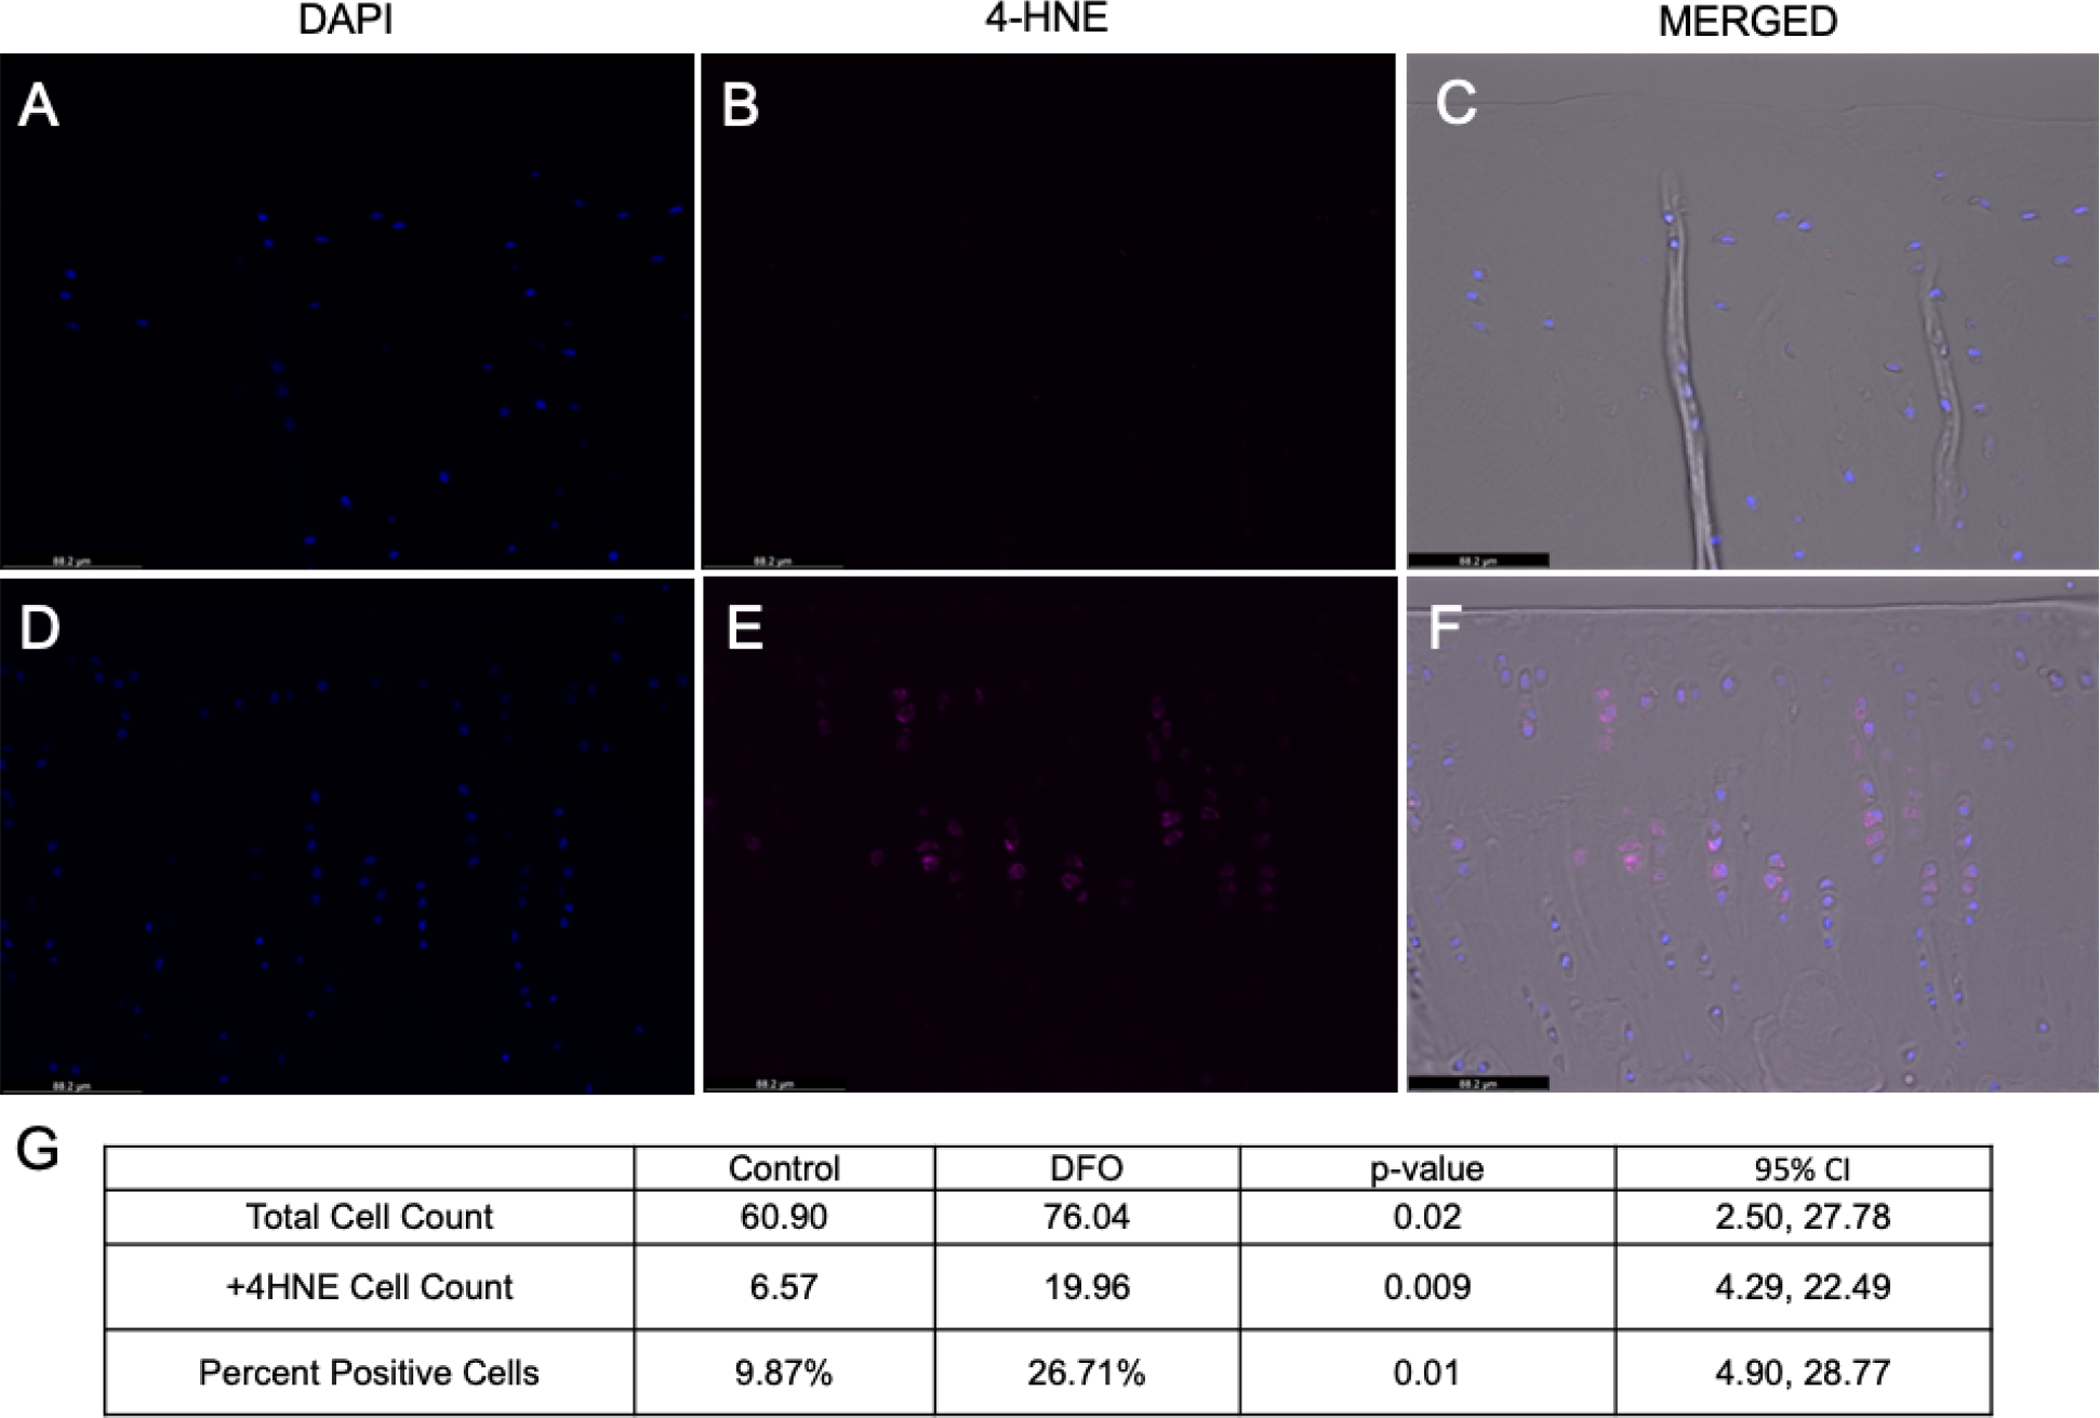
[A-C] 20X Representative images of MTP articular cartilage from a control animal. [A] Chondrocyte nuclei stained with DAPI. [B] Positive 4-HNE staining (Cy5 channel). [C] Merged image with phase contrast, DAPI, and 4-HNE (Cy5) channels. [D-F] 20X Representative images of MTP articular cartilage from a DFO-treated animal. [D] Chondrocyte nuclei stained with DAPI. [E] Positive 4-HNE staining (Cy5 channel). [F] Merged image with phase contrast, DAPI, and 4-HNE (Cy5) channels. [G] Mean values for total cell count, 4-HNE positive cell count, and the percentage of total cells positive for 4-HNE adducts.