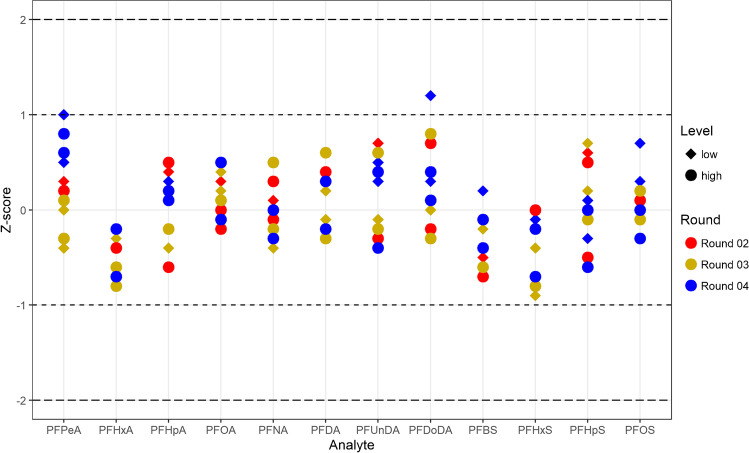
Fig. 2.
Results obtained from the analyses of samples from the interlaboratory comparison ICI-EQUAS. We did not participate in the exercise, but, using these samples as reference material, we compared our results with the reported reference values. Z-scores are plotted for each of the 12 analytes included in the exercise: the samples from three different rounds were analysed in two independent analytical sequences 6 months apart from each other

