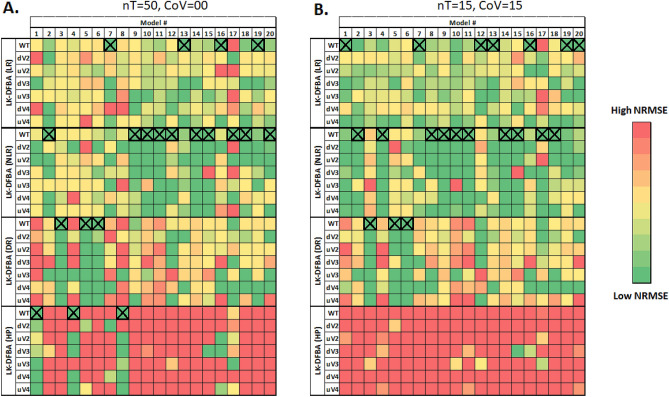
Figure 2.
NRMSE heatmap of LK-DFBA approaches on different synthetic models. Each constraint approach was used to fit parameters to wild-type (WT) data and then used to simulate the WT system and in silico genetic perturbations with fluxes v2, v3, or v4 down- or up-regulated. The best constraint approach for each WT model is indicated with an X. Dark green boxes represent the lowest NRMSE within each genetic perturbation for each synthetic model, while dark red boxes represent the highest NRMSE (meaning that the dynamic range of the color scale varies for each perturbation for each synthetic model to better convey the relative performance of different methods). Panel A shows results for noiseless data with a sampling frequency of 50 time points. Panel B shows results for noisy datasets with a sampling frequency of 15 time points and with noise added at a CoV of 0.15. The average NRMSE of 10 noisy datasets is shown in the heatmap. The same NRMSE heatmaps with explicitly annotated error values can be found in Figs. S1 and S5.

