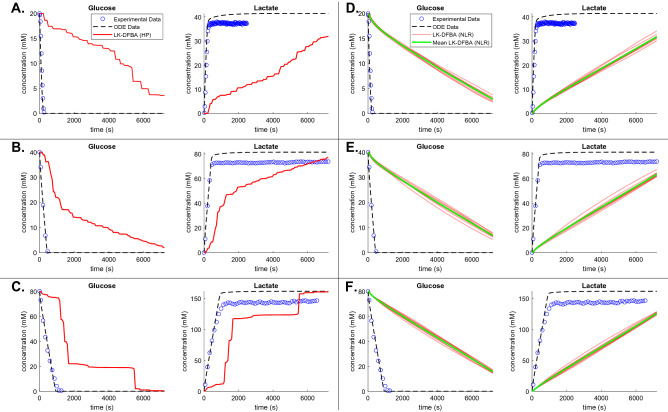
Figure 4.
Comparison of LK-DFBA metabolite concentration predictions against ODE data and L. lactis experimental data when fitted to noiseless and noisy ODE data. Panels A, B, and C depict concentration profiles for LK-DFBA (HP) (solid red line) and the ODE model (dashed black line) compared to experimental data (blue circles) for initial glucose concentrations of 20 mM, 40 mM, and 80 mM, respectively, when LK-DFBA is fitted to noiseless data. Panels D, E, and F depict concentration profiles for LK-DFBA (NLR) on 10 noisy datasets (nT = 15, CoV = 0.15) and the ODE model compared to experimental data. The mean concentration profile (solid green line) is shown with each of the concentration profiles (solid red lines) from the 10 noisy datasets.

