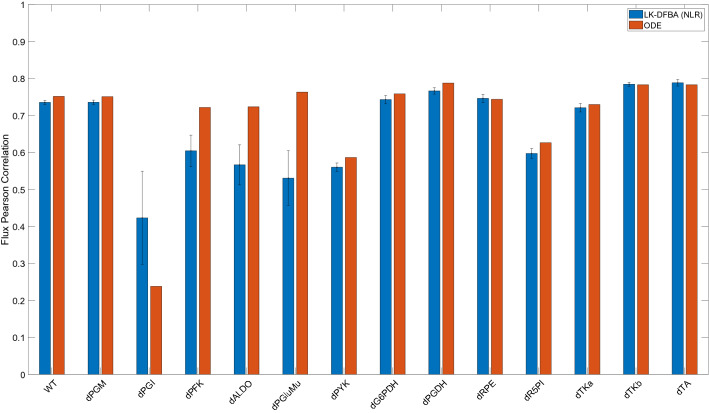
Figure 5.
Pearson correlation coefficients of LK-DFBA and ODE model flux predictions with E. coli experimental data. LK-DFBA (NLR) was the best approach when fitting on low sampling frequency (nT = 15) and high noise (CoV = 0.15) data. Blue and red bars represent LK-DFBA (NLR) and ODE model mean correlations, respectively, between the average predicted flux profiles and experimental steady-state flux data for the wildtype system and various gene knockout conditions. Gene knockouts in the LK-DFBA and ODE-based models were simulated by down-regulating relevant pathways. Error bars for LK-DFBA represent one standard deviation (N = 10 runs).

