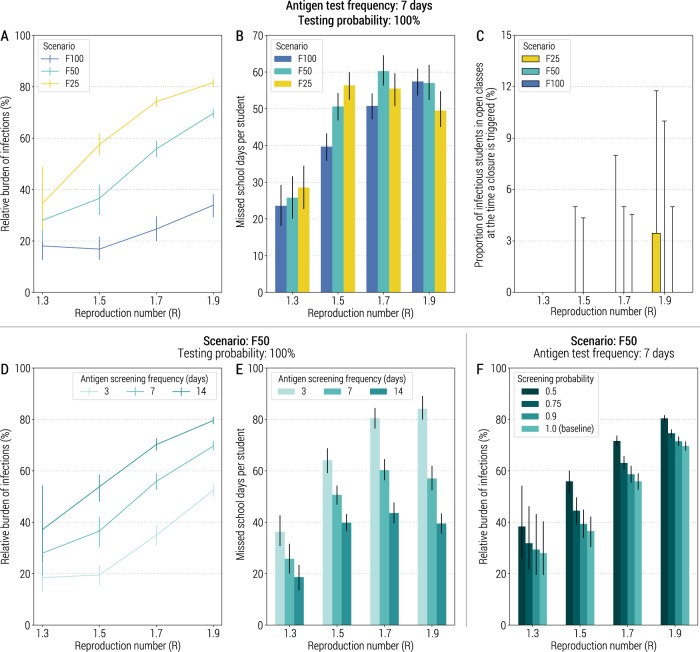
Fig. 4. Impact of reactive class-closure policy relying on antigen screening.
A Relative burden of the cumulative number of infections after 1 year as a function of the reproduction number and for different scenarios about school transmission contribution. The line corresponds to the mean value, while the vertical line represents the 95% quantile intervals; colors refer to the three scenarios F25, F50, and F100. The fraction of immune population at the beginning of epidemic is set at 10%, the probability of testing a student at school with the antigen test is 100%, the frequency of the antigen testing is weekly; other parameters are as the baseline values reported in Supplementary Tables 1 and 2. Note that R is estimated in the absence of the class-closure strategy. The relative burden is defined as the estimated number of infections after 1 year since the introduction of the first infected individual with the class-closure strategy implemented, relative to the estimated number without the implementation of the class-closure strategy. For each scenario, 500 stochastic simulations were performed. B Number of missed school days per student due to the reactive class-closure strategy. The bar corresponds to the mean value, while the vertical line represents 95% quantile intervals. C Proportion of infectious students in all the open classes of the school (i.e., excluding the class triggering the class closure) for different values of R at the time when a class closure is triggered. The boxplot indicates quantile 0.025, 0.25, 0.5, 0.75, and 0.975. D As in (A), but for scenario F50 and by varying the frequency of testing (every 3, 7, or 14 days). E As in (B), but for scenario F50 and varying frequency of testing (every 3, 7 or 14 days). F As in (A), but for scenario F50 and by varying the probability of antigen testing (50%, 75%, 90%, and 100%). The bar corresponds to the mean value, while the vertical line represents 95% quantile intervals.

