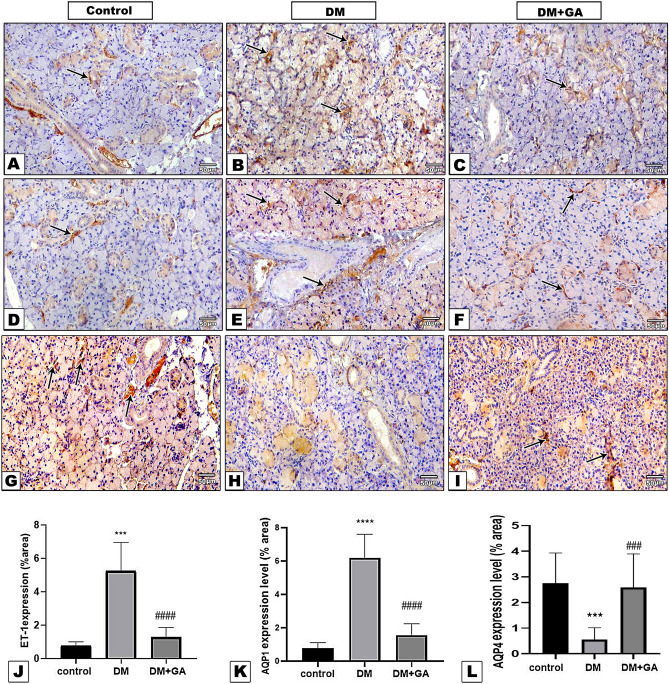
Figure 5.
ET1 immunostained sections of SMG shows positive brown reaction around interlobular ducts and blood vessels in control group (A), DM group shows mucous changes in the acini with marked expression of ET1 in vascular and acinar components of the parenchyma (B). GA application reduced ET-1 expression (C). AQP1 immunoreaction was localized in the parenchymal vasculature of SMG in control group (D) and GA treated group (F), while this reaction was markedly increased in DM group (E). GA restored AQP4 expression levels in diabetic SMG tissue (I) where diabetic group showed a marked reduction in AQP4 expression (H) compared to the control group (G). (ET-1, AQP1, AQP4 IHC, × 20). Quantitative analysis of immunostaining %area of ET-1 (J), AQP1 (K) and AQP4 (L). Data were expressed in mean ± SE. P < 0.05 is considered significant. ***Significant compared to control group at P < 0.001, ****Significant compared to control group at P < 0.0001, ###Significant compared to diabetic group at P < 0.001. ####Significant compared to diabetic group at P < 0.0001.

