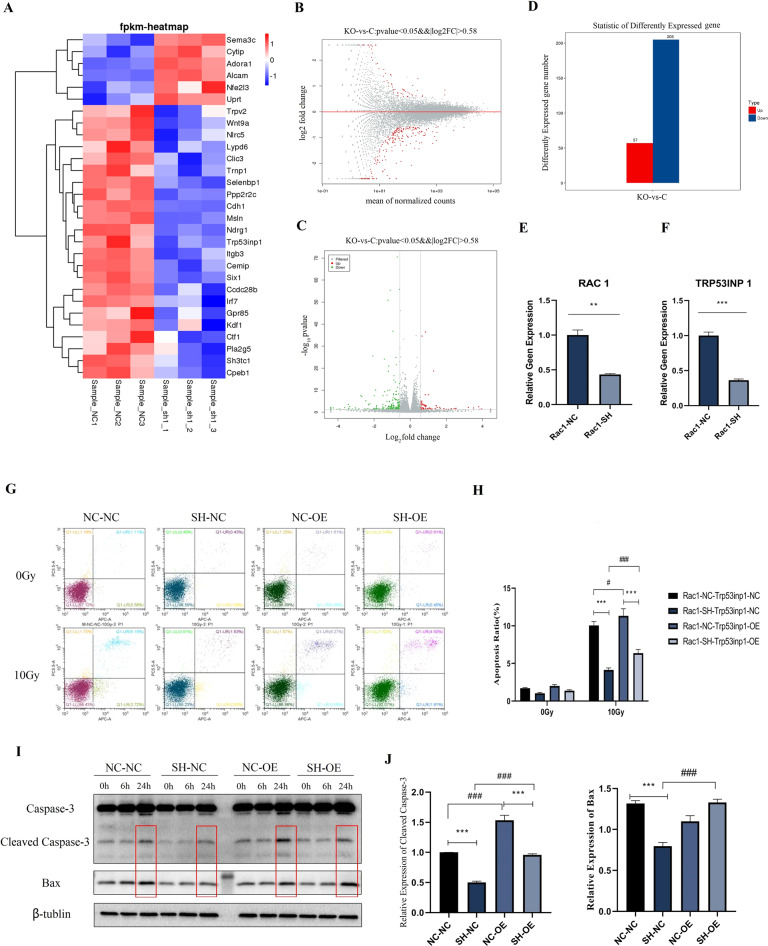
Fig. 3. Identification of Trp53inp1 as the critical downstream target of Rac1 by RNA-Seq analysis.
RNA-seq and qPCR analysis of differential expression genes between Rac1 knockdown (Rac1-SH) and control (Rac1-NC) MLE-12. A Cluster analysis results of differential expression genes. B–D MA diagram, Volcano map, and histogram of differential expression genes. Red column represents the genes upregulated by Rac1 knockdown, and blue represents the genes downregulated. P < 0.05, |log 2FC| > 0.58. A total of 262 differential genes were caused by Rac1 knockdown, of which 205 genes were downregulated and 57 genes were upregulated. E, F qPCR analysis of relative gene expression level of Rac1 and Trp53inp1 between Rac1-SH and Rac1-NC MLE-12. Trp53inp1 overexpression (OE) and negative control (NC) MLE-12 cell lines were constructed on the basis of Rac1-NC and Rac1-SH MLE-12 cells, yielding a total of 4 kinds of genetically modified MLE-12 cells, which were Rac1-NC+ Trp53inp1-NC (represented as NC-NC), Rac1-SH+ Trp53inp1-NC (represented as SH-NC), Rac1-NC+ Trp53inp1-OE (represented as NC-OE) and Rac1-SH-Trp53inp1-OE (represented as SH-OE). All 4 kinds of cells were collected before (0 Gy) and at designed time points after 10 Gy of irradiation. G, H Apoptosis ratio detected by a flow cytometer. I, J Apoptosis-related proteins, Bax and Caspase-3 were detected by WB analysis. ** and *** represented P < 0.01 and 0.001 between the corresponding groups, respectively. The error value was expressed as mean ± SEM. Experiments were repeated three times.

