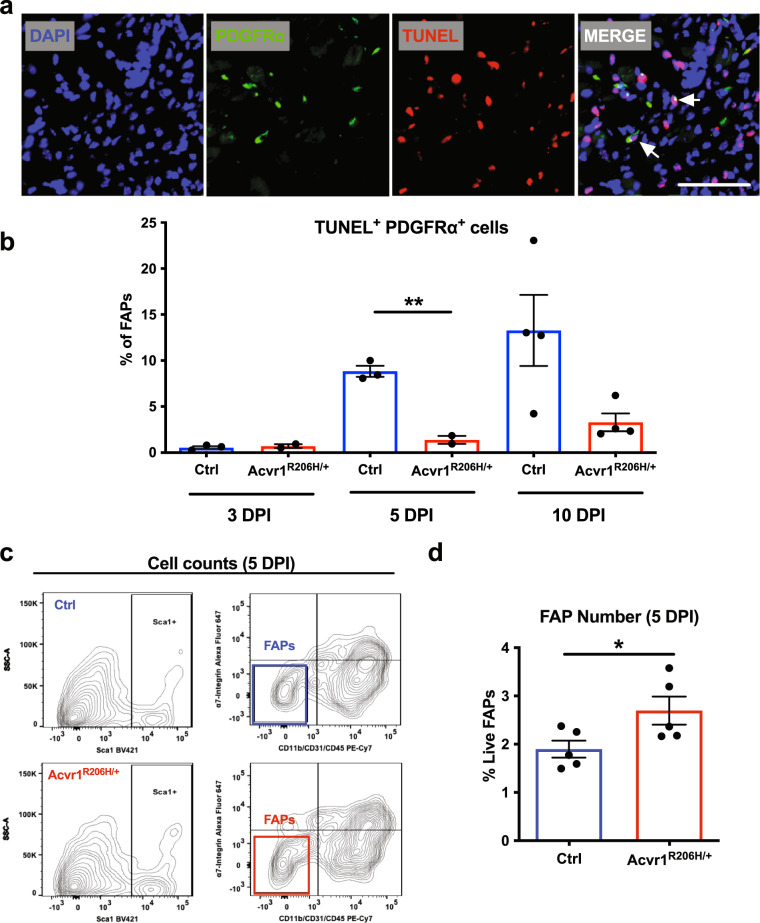
Fig. 3. Acvr1R206H/+ FAPs fail to decline during regeneration.
a Representative images of control and Acvr1R206H/+ cryosections stained with the FAP marker PDGFRα (green) and DAPI (nuclei; blue), and processed for cell death by TUNEL (red). Scale bar = 50 μm. b Analysis of TUNEL positive FAPs at 3-, 5-, and 10- days post-CTX injury. N = 2–5 mice per condition per genotype. Mean ± SEM displayed. Statistical significance was determined by unpaired student t-tests with Welch’s correction. **p ≤ 0.01. c Flow cytometry scatter plots of FAPs from 5 DPI mice. d Analysis of FAP numbers by flow cytometry. Mean ± SEM displayed. Significance was determined by student t-tests. *p ≤ 0.05. n = 5–6 mice per genotype.

