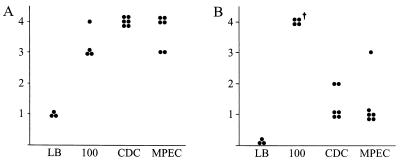
FIG. 4.
Graphic representation of histologic scores for hyperplasia (A) and necrosis (B) of H&E-stained colonic tissue, showing that all three strains were able to induce similar levels of hyperplasia while only DBS100 (labeled 100) induced necrosis. Each dot represents one animal. The y axis represents an increasing scale of severity from 0 to 4, as described in Materials and Methods. The Mann-Whitney U test was used to calculate P values. The dagger indicates a statistically significant difference (P < 0.05) between CDC1843-73T (CDC) and MPEC. All groups in both panels are statistically different from the applicable LB controls (P < 0.05).

