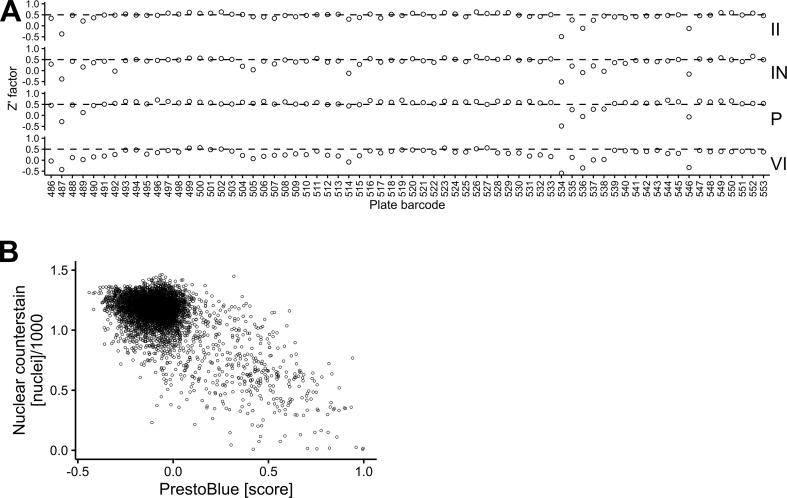
figs1.
Z’ factors of each screening plate and comparison between nuclear counterstain and PrestoBlue. A) Each facet depicts the per-plate Z’ factors for the assessed parameters. II: infection index, IN: infected nuclei, P: plaques, VI: total virus intensity. The dashed line intersects the y-axis at 0.5. Mean Z’ factors are II = 0.432, IN = 0.378, P = 0.509, VI = 0.276. B) The number of nuclei was assessed based on the nuclear counterstain in the screening setup. In contrast, the PrestoBlue based assay was performed in absence of virus, but all the other parameters were kept the same. The score of the Prestoblue assay was normalized with the positive control set as 1, and the negative control as 0. As a result, there is a negative correlation between the parameters.

