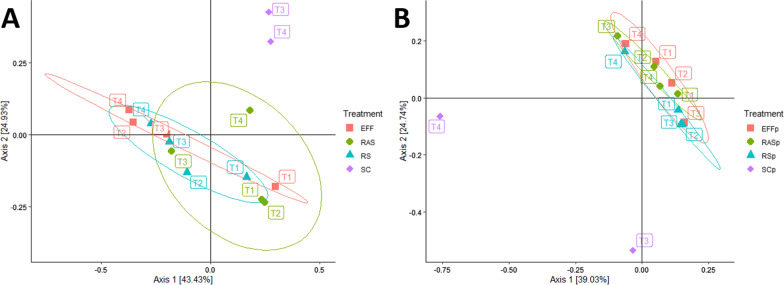
Fig. 1.
Principal coordinates analysis across treatments using the Bray–Curtis distance matrix at the species level. A Comparison of the bacterial samples stratified by domain, principal components 1 and 2 explain 68.36% of the variation. B Comparison of the phage samples stratified by domain, principal components 1 and 2 explain 63.77% of the variation. Effluent (EFF), returned activated sludge (RAS), raw sewage/influent (RS), dewatered sludge (SC), negative control (NEG), October (T1), November (T2), December (T3), February (T4), notation of “p” indicates phage sample

