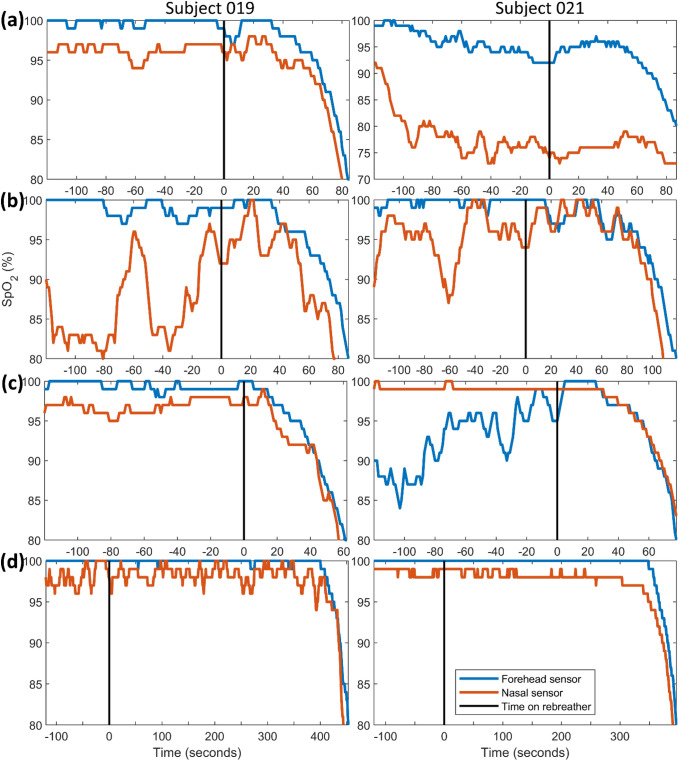
Figure 3.
Representative SpO2 data traces from the forehead and nasal sensor. (a) Test sequence 1: cold water, moderate work rate (b) Test sequence 2: cold water, light work rate (c) Test sequence 3: warm water, moderate work rate (d) Test sequence 4: warm water, moderate work rate, chamber pressurized to 77 fsw. Note that several of the traces from sequences at surface pressure (a–c) show artifacts from sensors that have been dislodged, affected by water intrusion, or are experiencing normal artifacts from motion. The data set in this figure was selected to provide a broad range of curves, from those where the sensors were successful (e.g., 019d and 021d) and also those where the sensors yielded problematic results that indicated a need for improved sensor engineering (e.g., 021a and 019b nasal traces). Both the quantity and the magnitude of artifacts were greatly diminished in the data traces at depth for all subjects, likely because of the increase partial pressure of oxygen. Please see note in Fig. 2 caption regarding the variable location of the vertical black lines that indicate the time the subject was switched to the rebreather.

