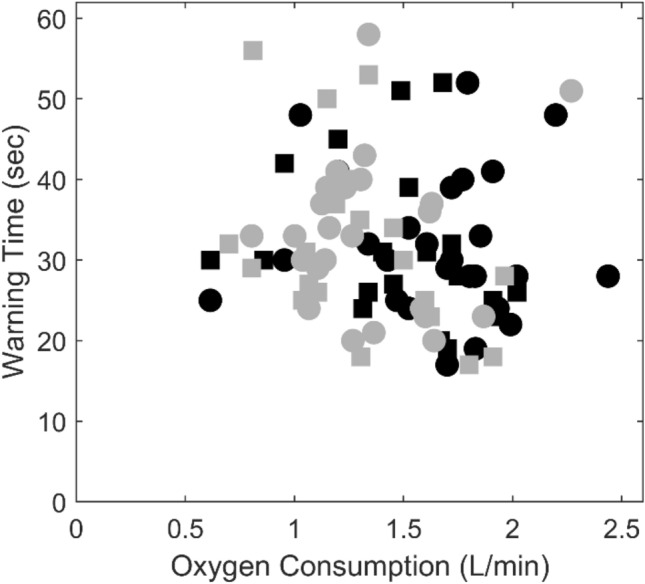
Figure 4.

Warning times plotted compared to rate of oxygen consumption. Circles indicate a warning time that was measured by a sensor placed on the forehead, squares a sensor on the nasal ala. Black markers indicate the test was conducted in warm water, grey indicates cold water.
